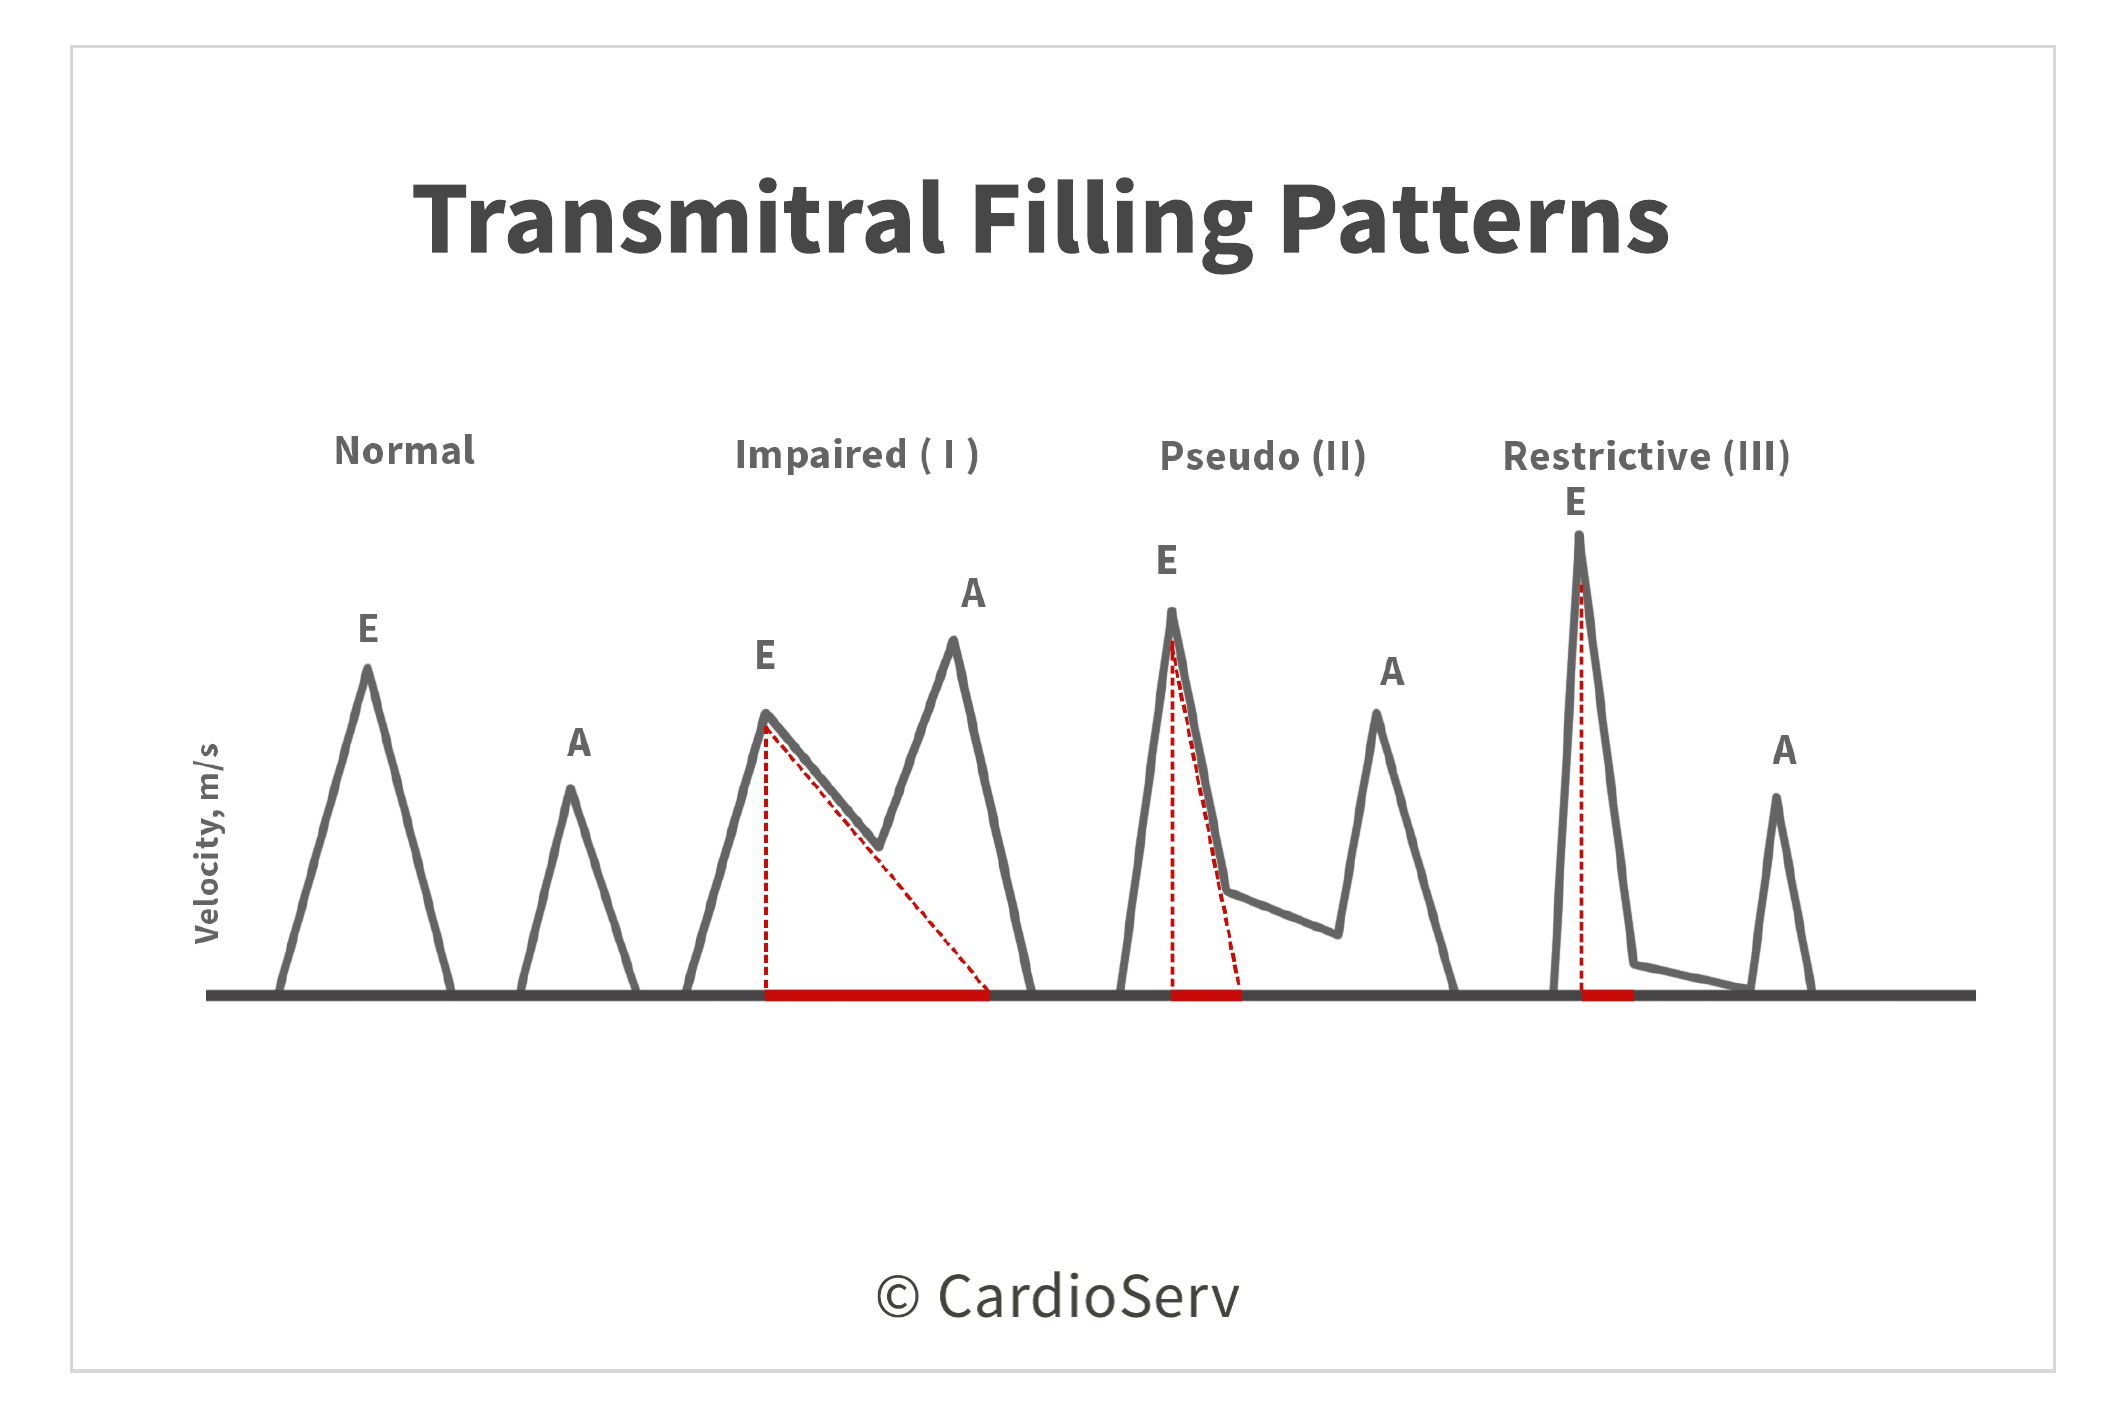
Let’s discuss the transmitral filling patterns as the severity of diastolic dysfunction progresses. The transmitral pressure gradients are reflective upon the E & A-wave velocities. The waveforms are influenced by the ability of the ventricle to relax and the compliance of the LA to generate a PG to allow rapid filling during diastole.
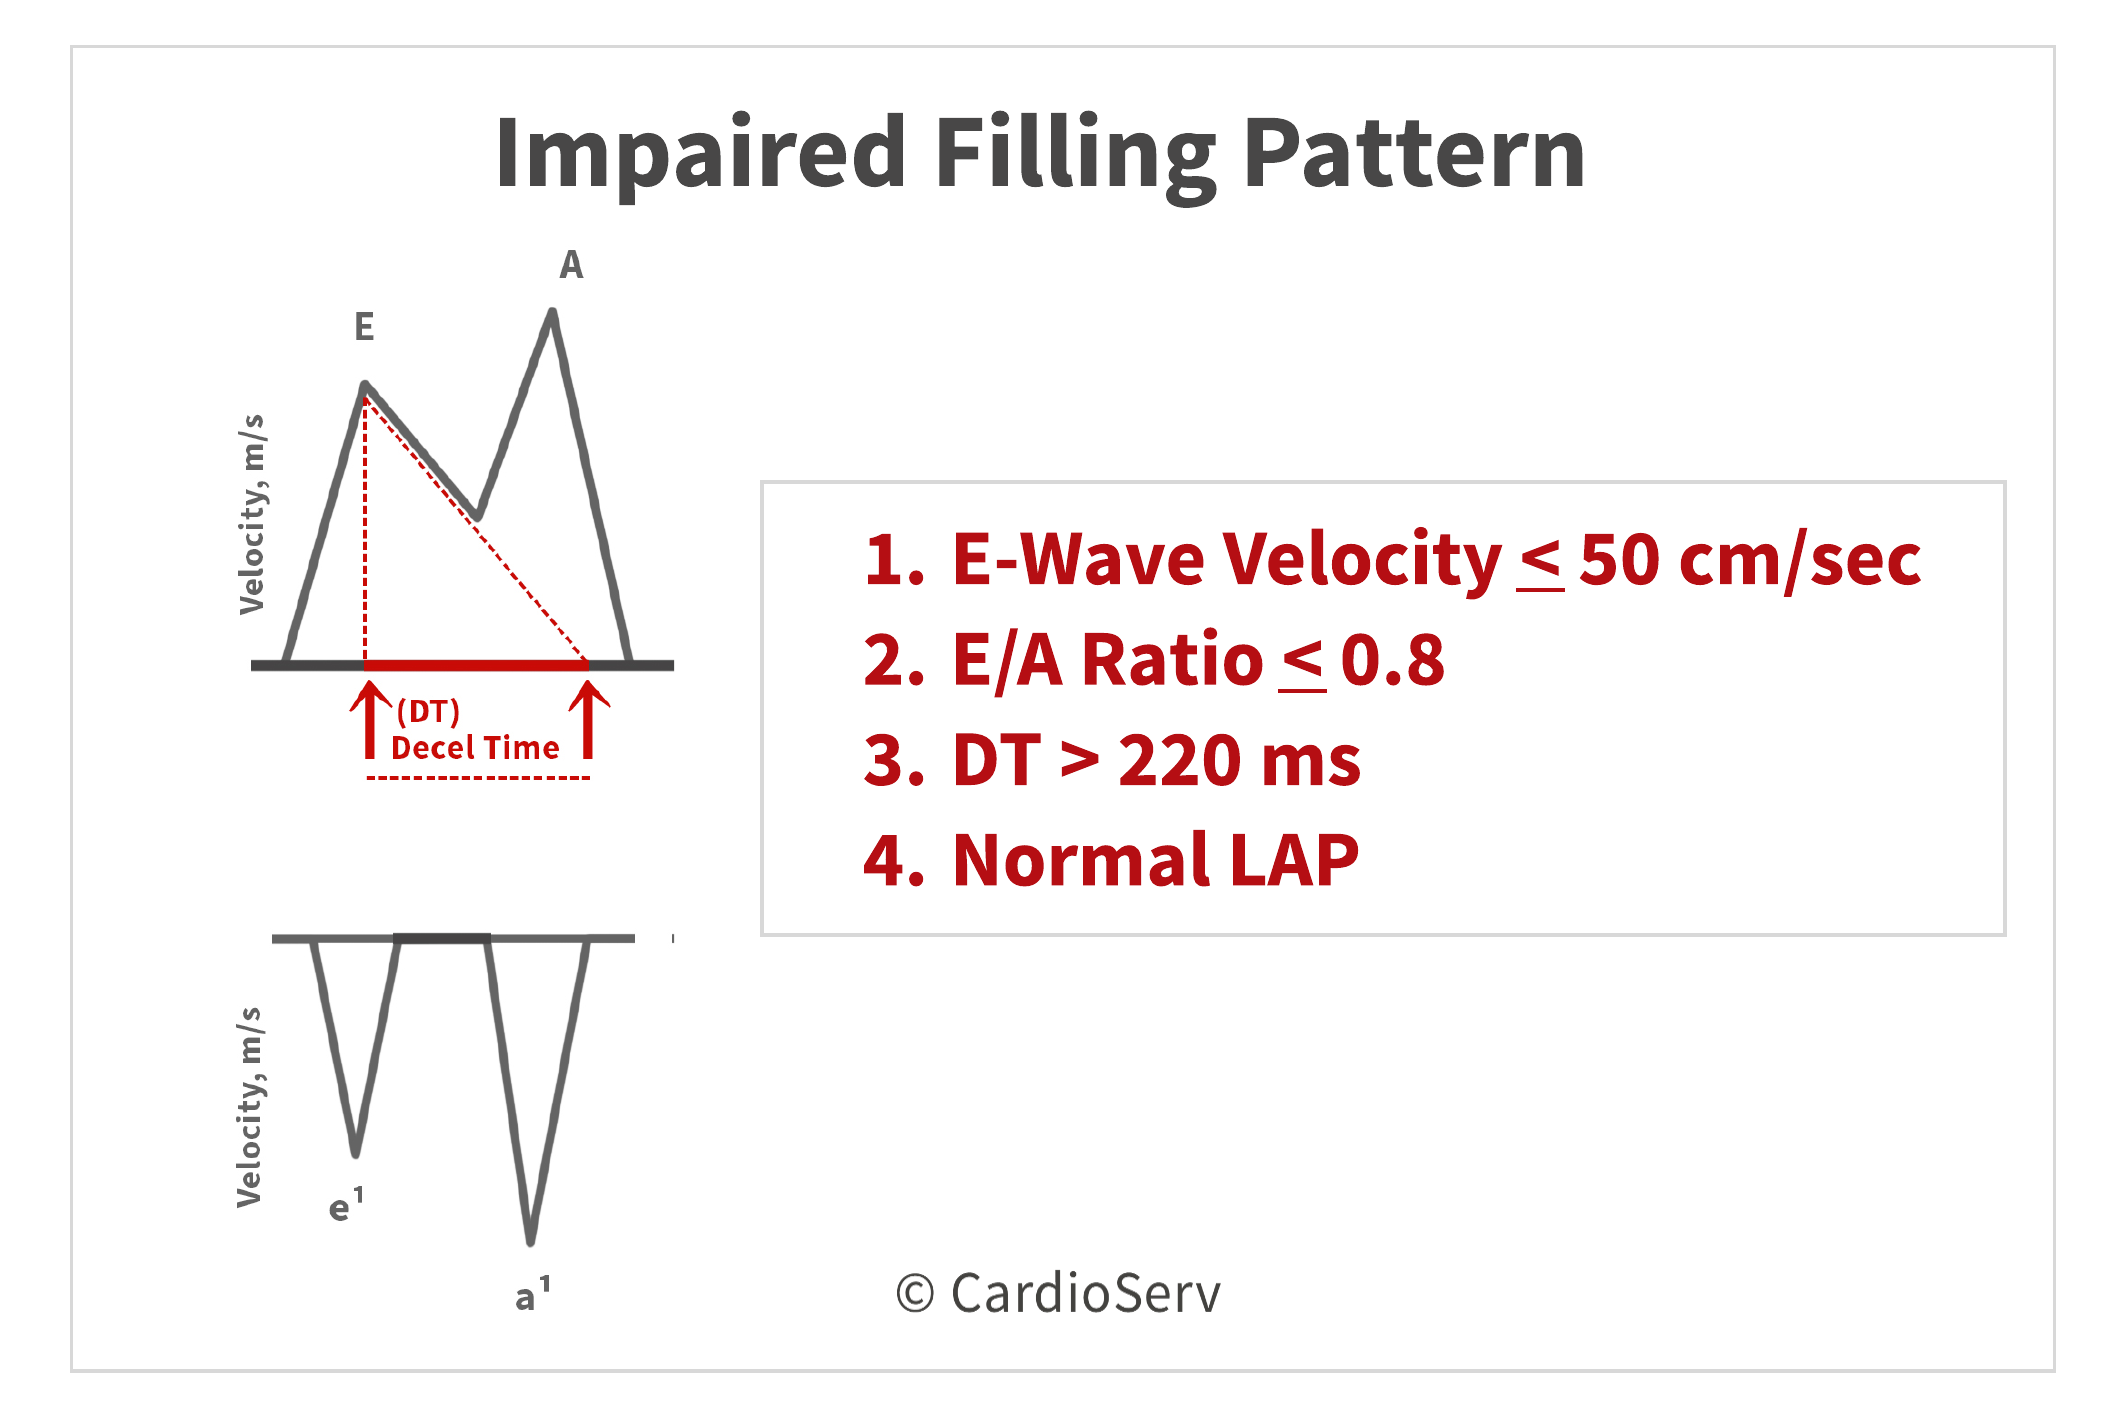
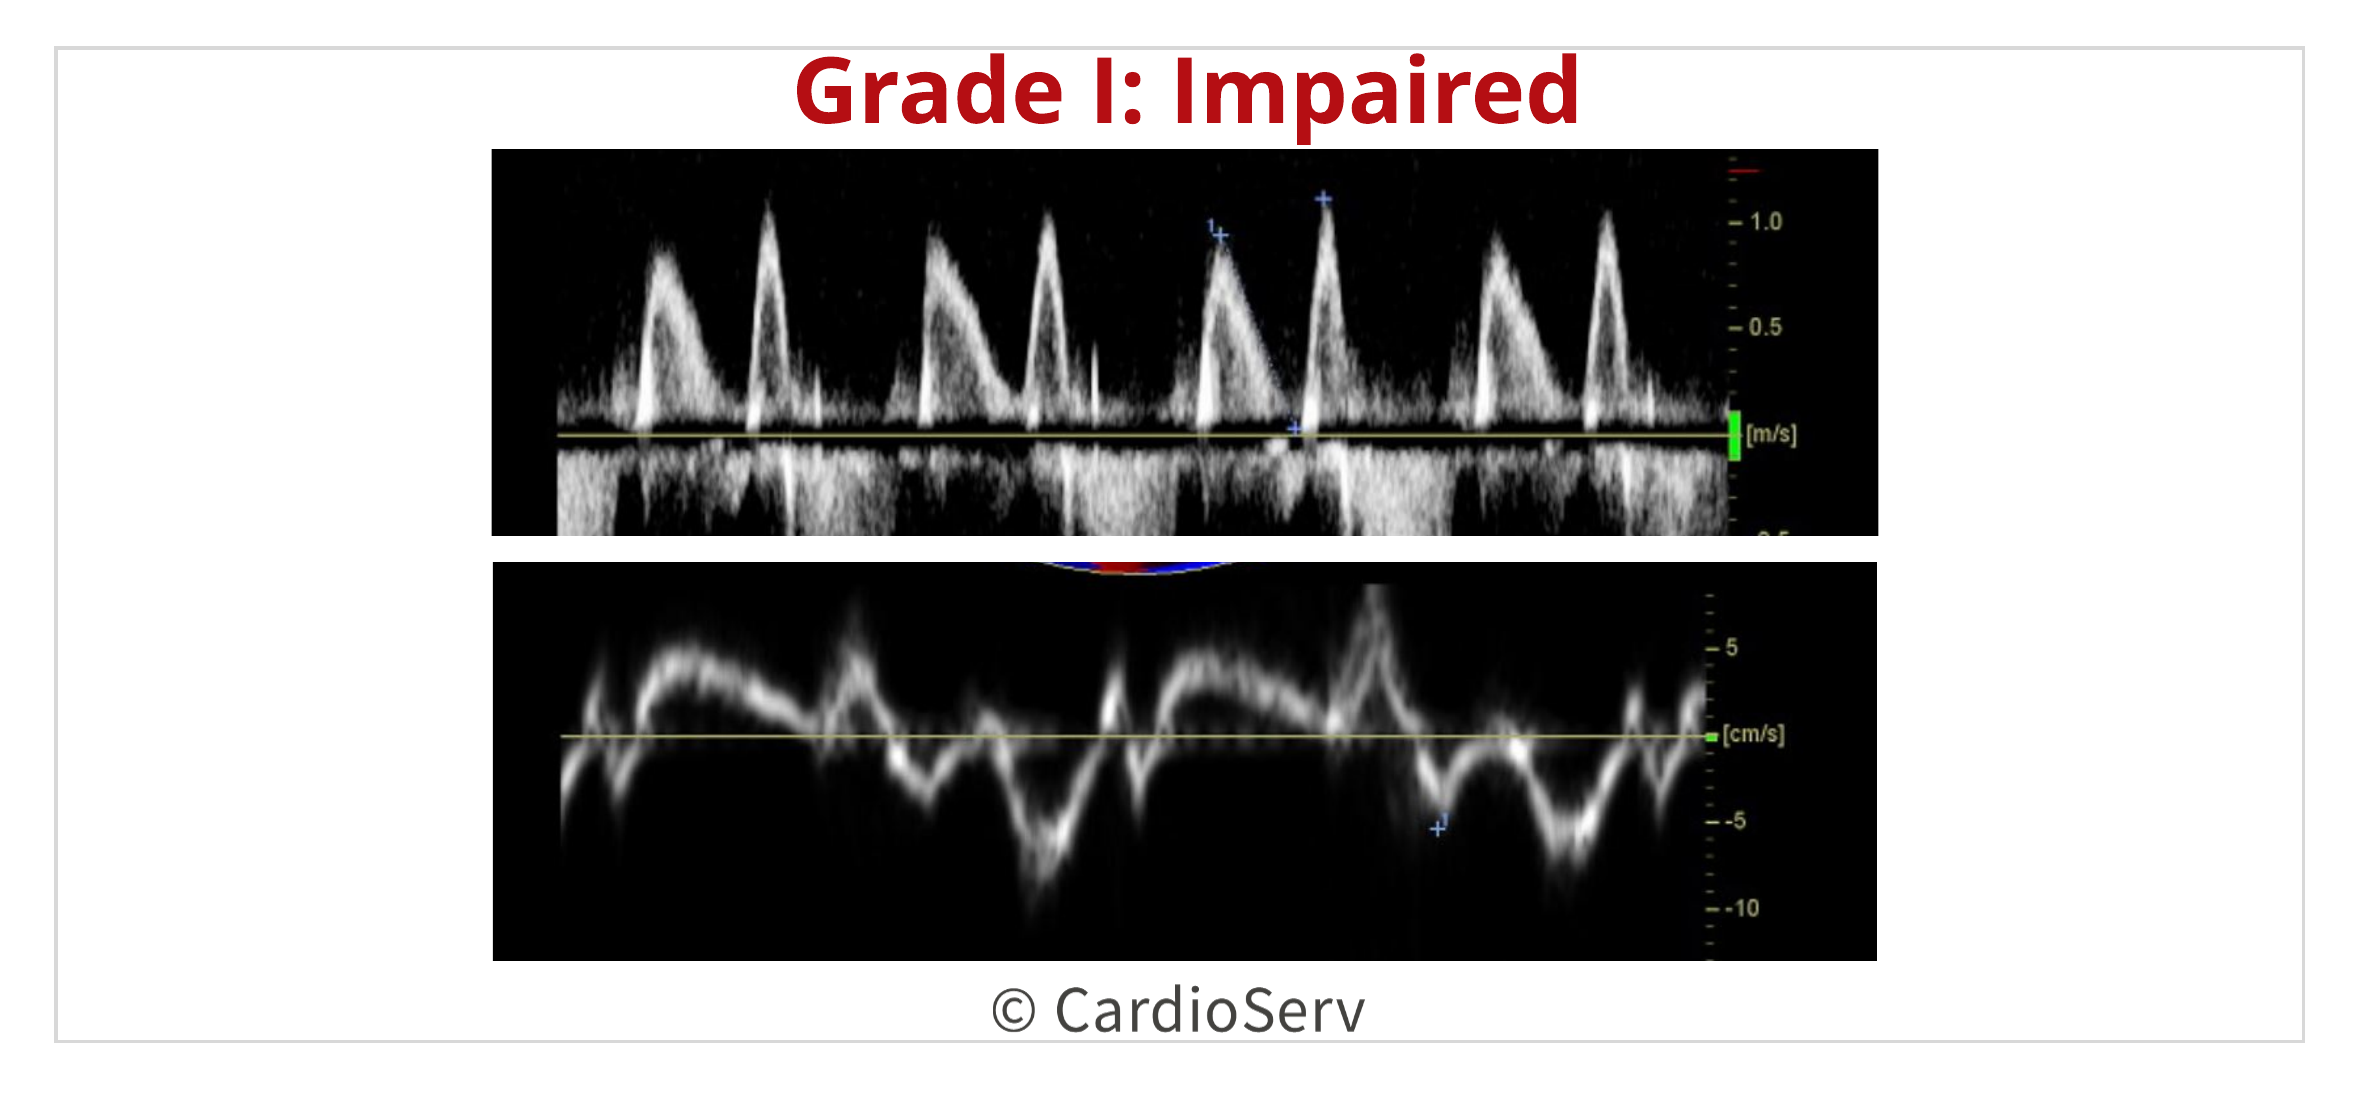
In the early phase of diastolic dysfunction, the compliance of the ventricle decreases causing a prolonged relaxation and decreased rapid filling phase of diastole. When relaxation is prolonged, the isovolumic relaxation time will be increased on the Doppler tracing, > 70 msec. The heart reacts to the lack of rapid filling by an increase in atrial contraction phase as an attempt to push the blood into the ventricle. The decrease in rapid filling phase is demonstrated by a decrease E-wave velocity, usually < 50 cm/sec. The E-wave deceleration time (DT) will be elongated due to prolongation of impaired relaxation, usually >220 msec. The forceful atrial contraction phase is demonstrated by an increase in A-wave velocity, presenting with a decreased E/A ratio < 0.8. The left atrial pressure (LAP) will remain relatively normal.
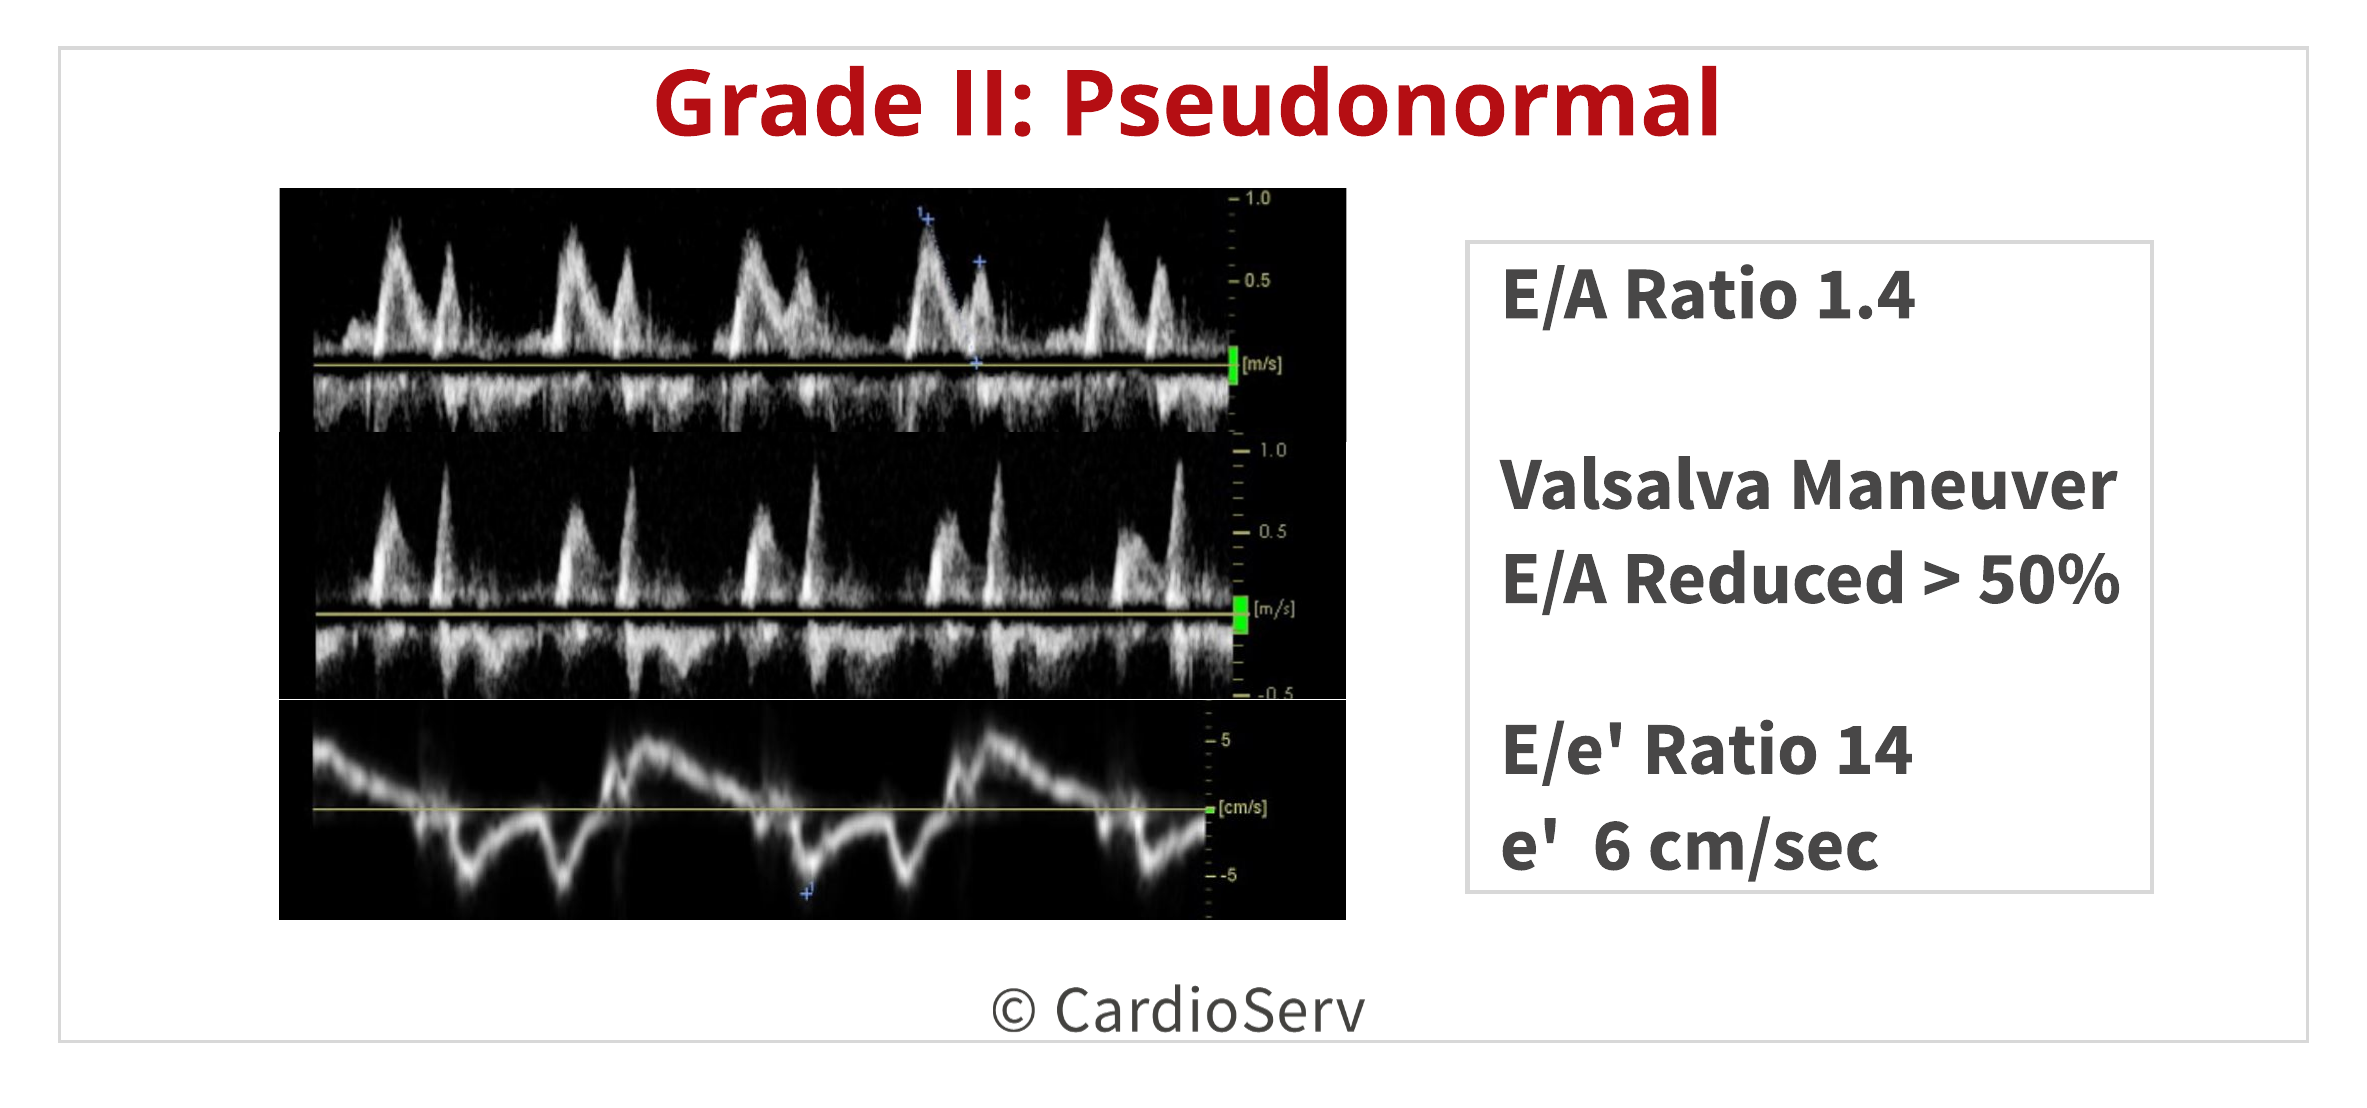
 Grade II: Pseudonormal
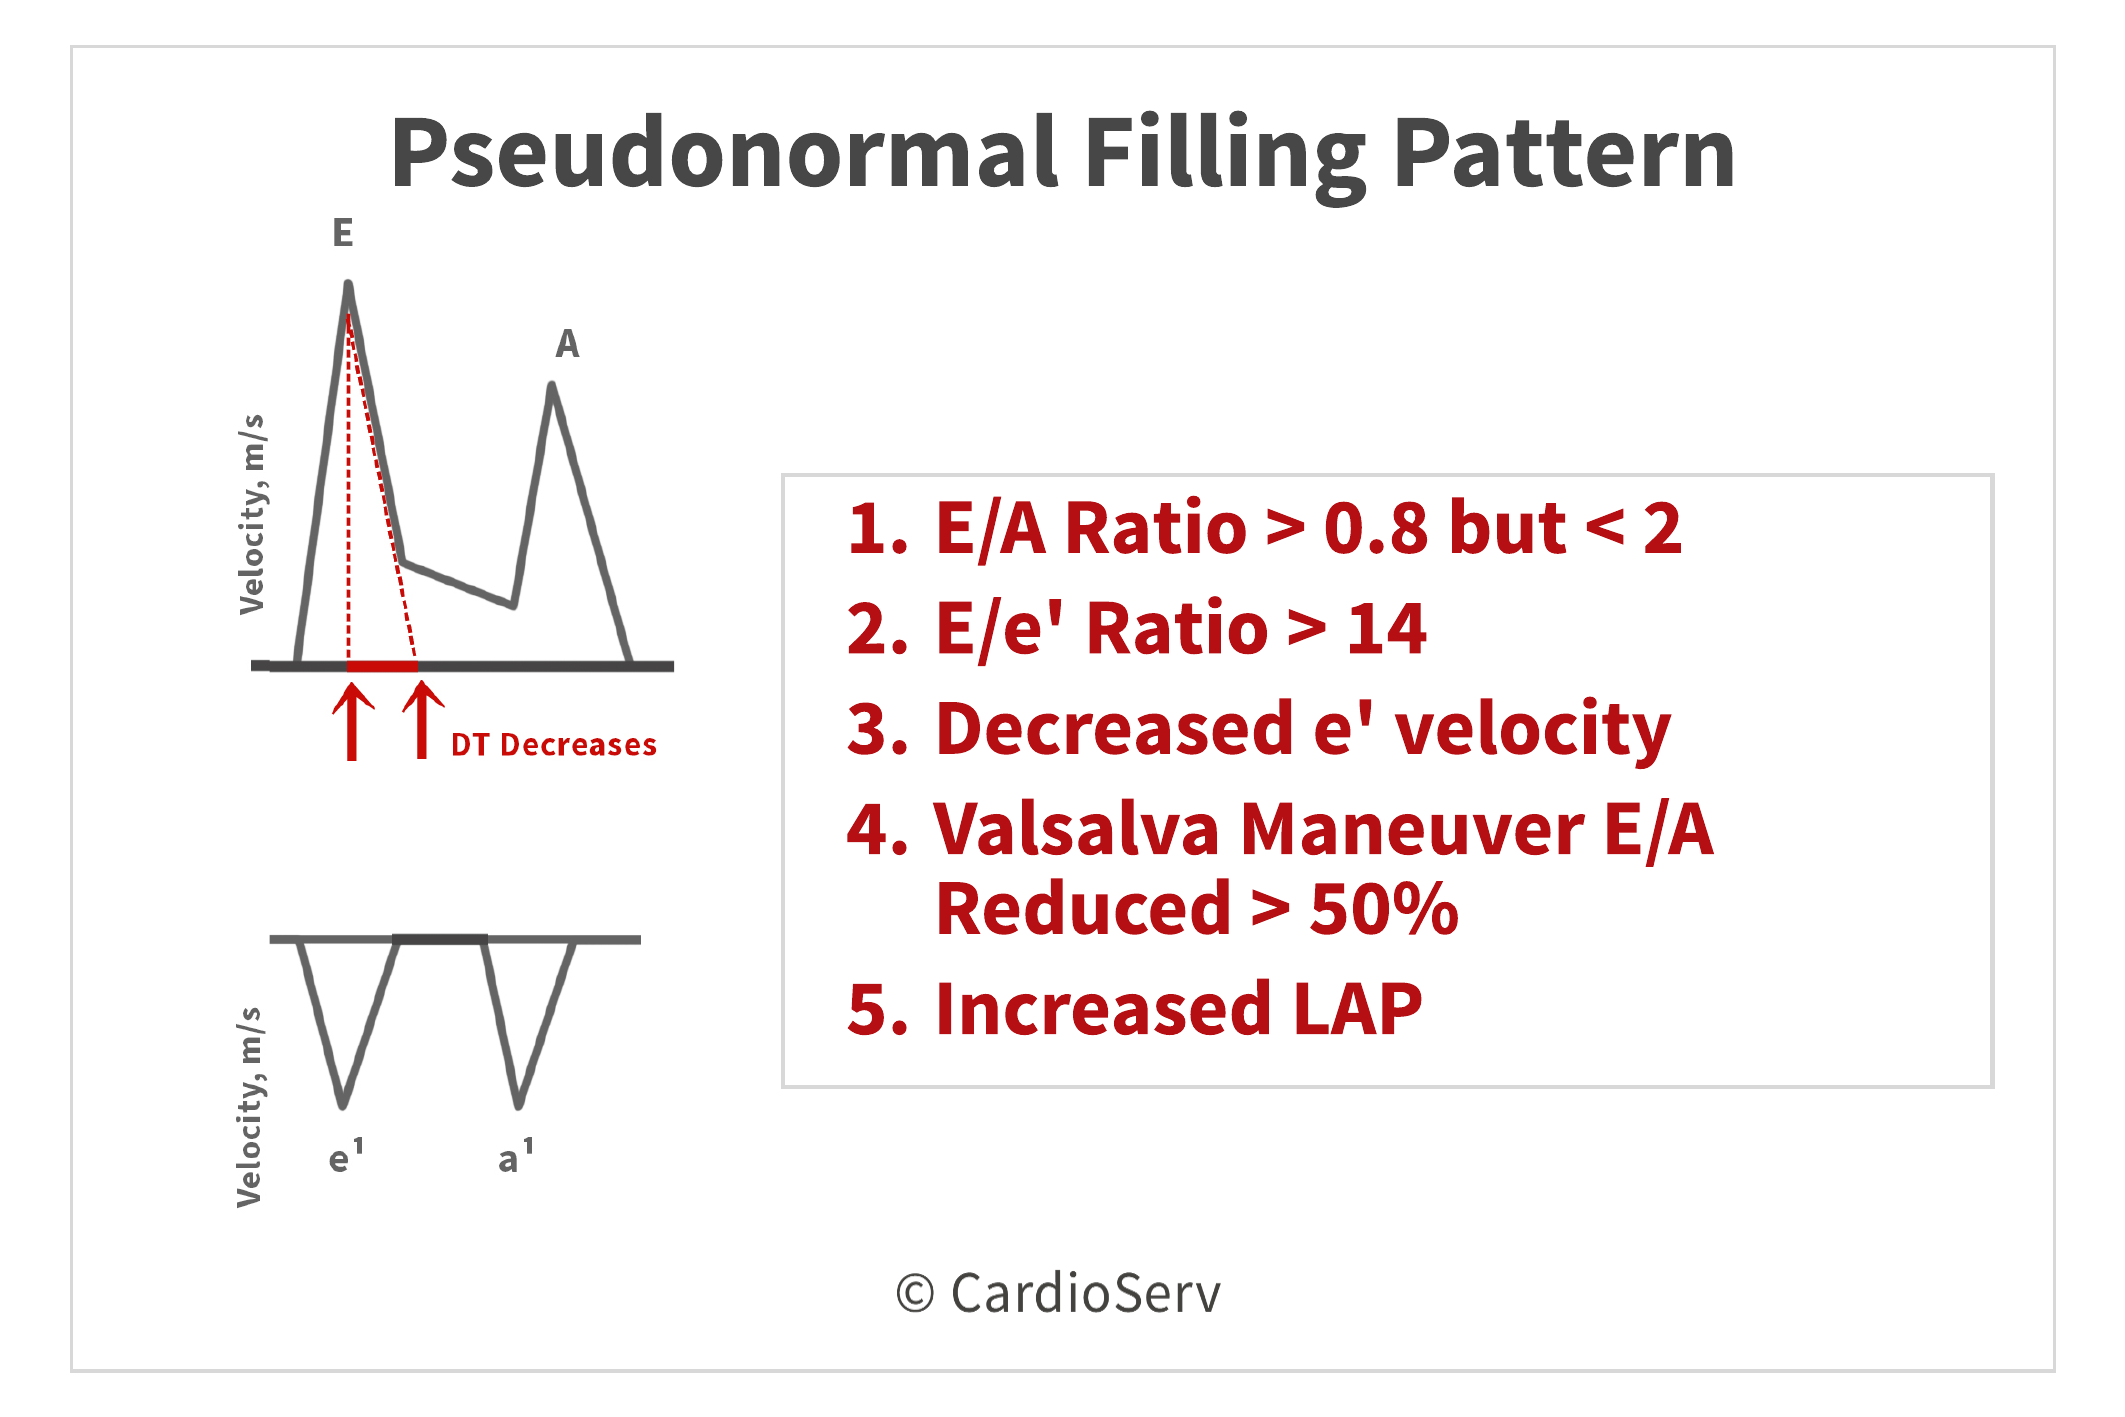
After the ventricle’s compliance decreases for an extended length in time, with increasing the LV filling pressures and preload, the LAP will increase to ensure sufficient blood is being filled in the LV. The LAP increase allows the rapid filling phase to return to a normal state, causing the E-wave velocity to increase back up. This increase in LAP causes the E/A ratio to be > 0.8, but < 2 and the DT decreased to a relative normal state.
Since the transmitral flow is load dependent, the E-wave will mimic a normal velocity but the mitral annular e’ (which is load independent) will be decreased. This causes an increase in E/e’ ratio >14.
This grade of diastolic dysfunction can cause a lot of uncertainty and conflicting information. In order to properly determine if this filling pattern represents normal or truly pseudonormal patterns, other evaluation methods must be performed. First, the Valsalva maneuver can help remove the altered effects of the loading conditions on the transmitral flow waveforms. We can also use the presence of a tricuspid regurgitation (TR) velocity > 2.8 m/s or left atrial volume index (LAVI) > 34 mL/m².
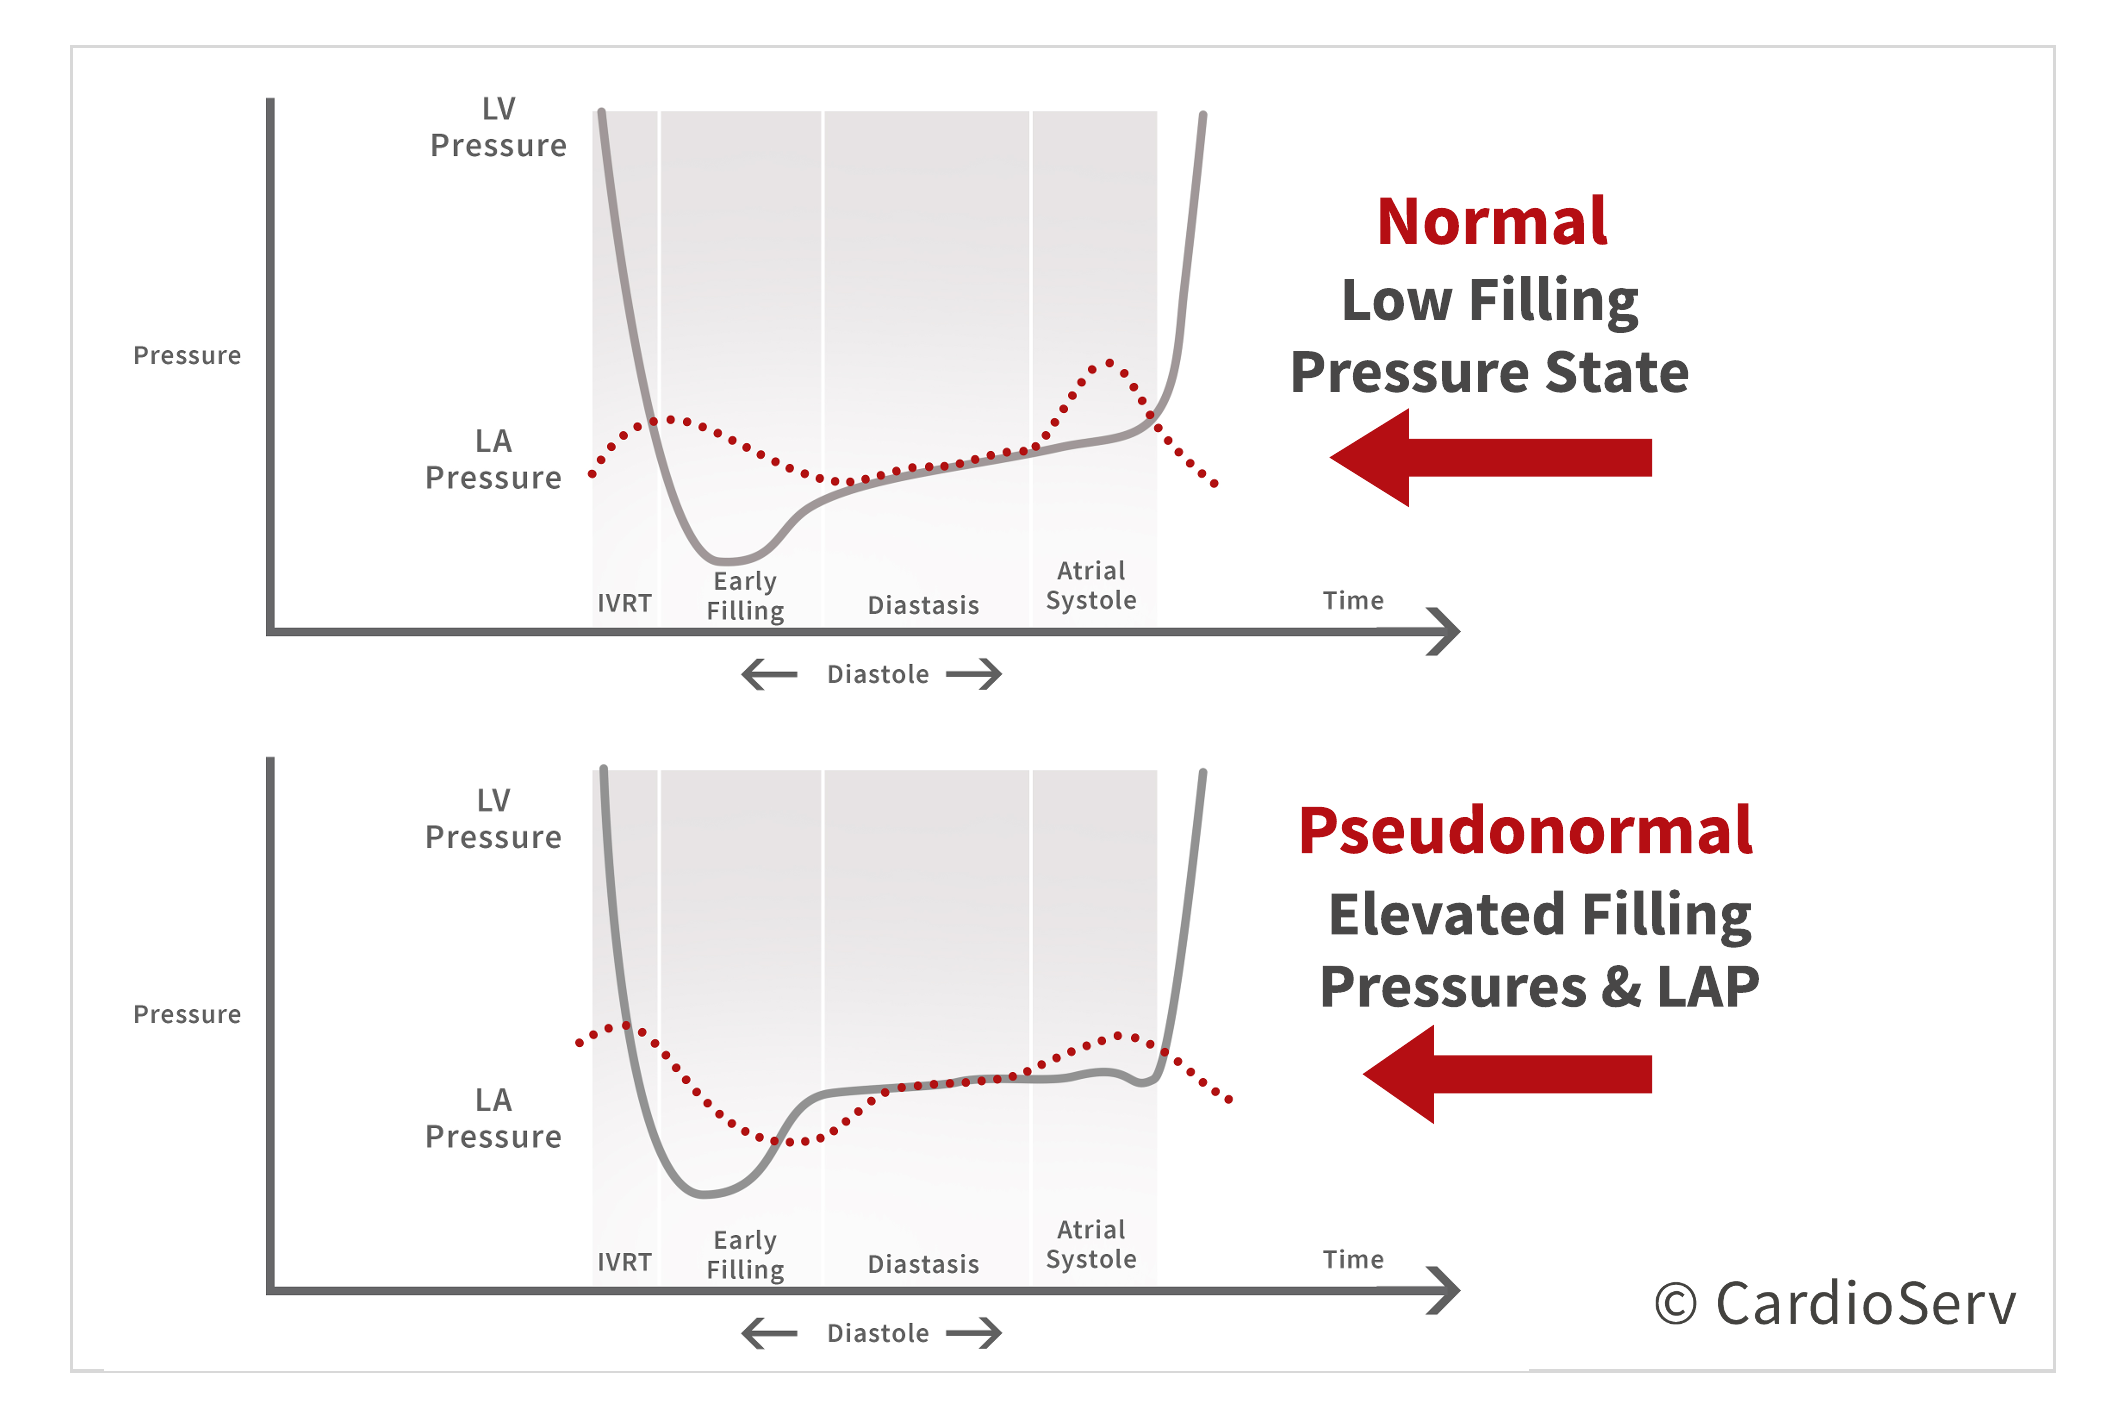
 We can view the pressure change between the LV and LA as the diastolic dysfunction progresses into a pseudonormal state.
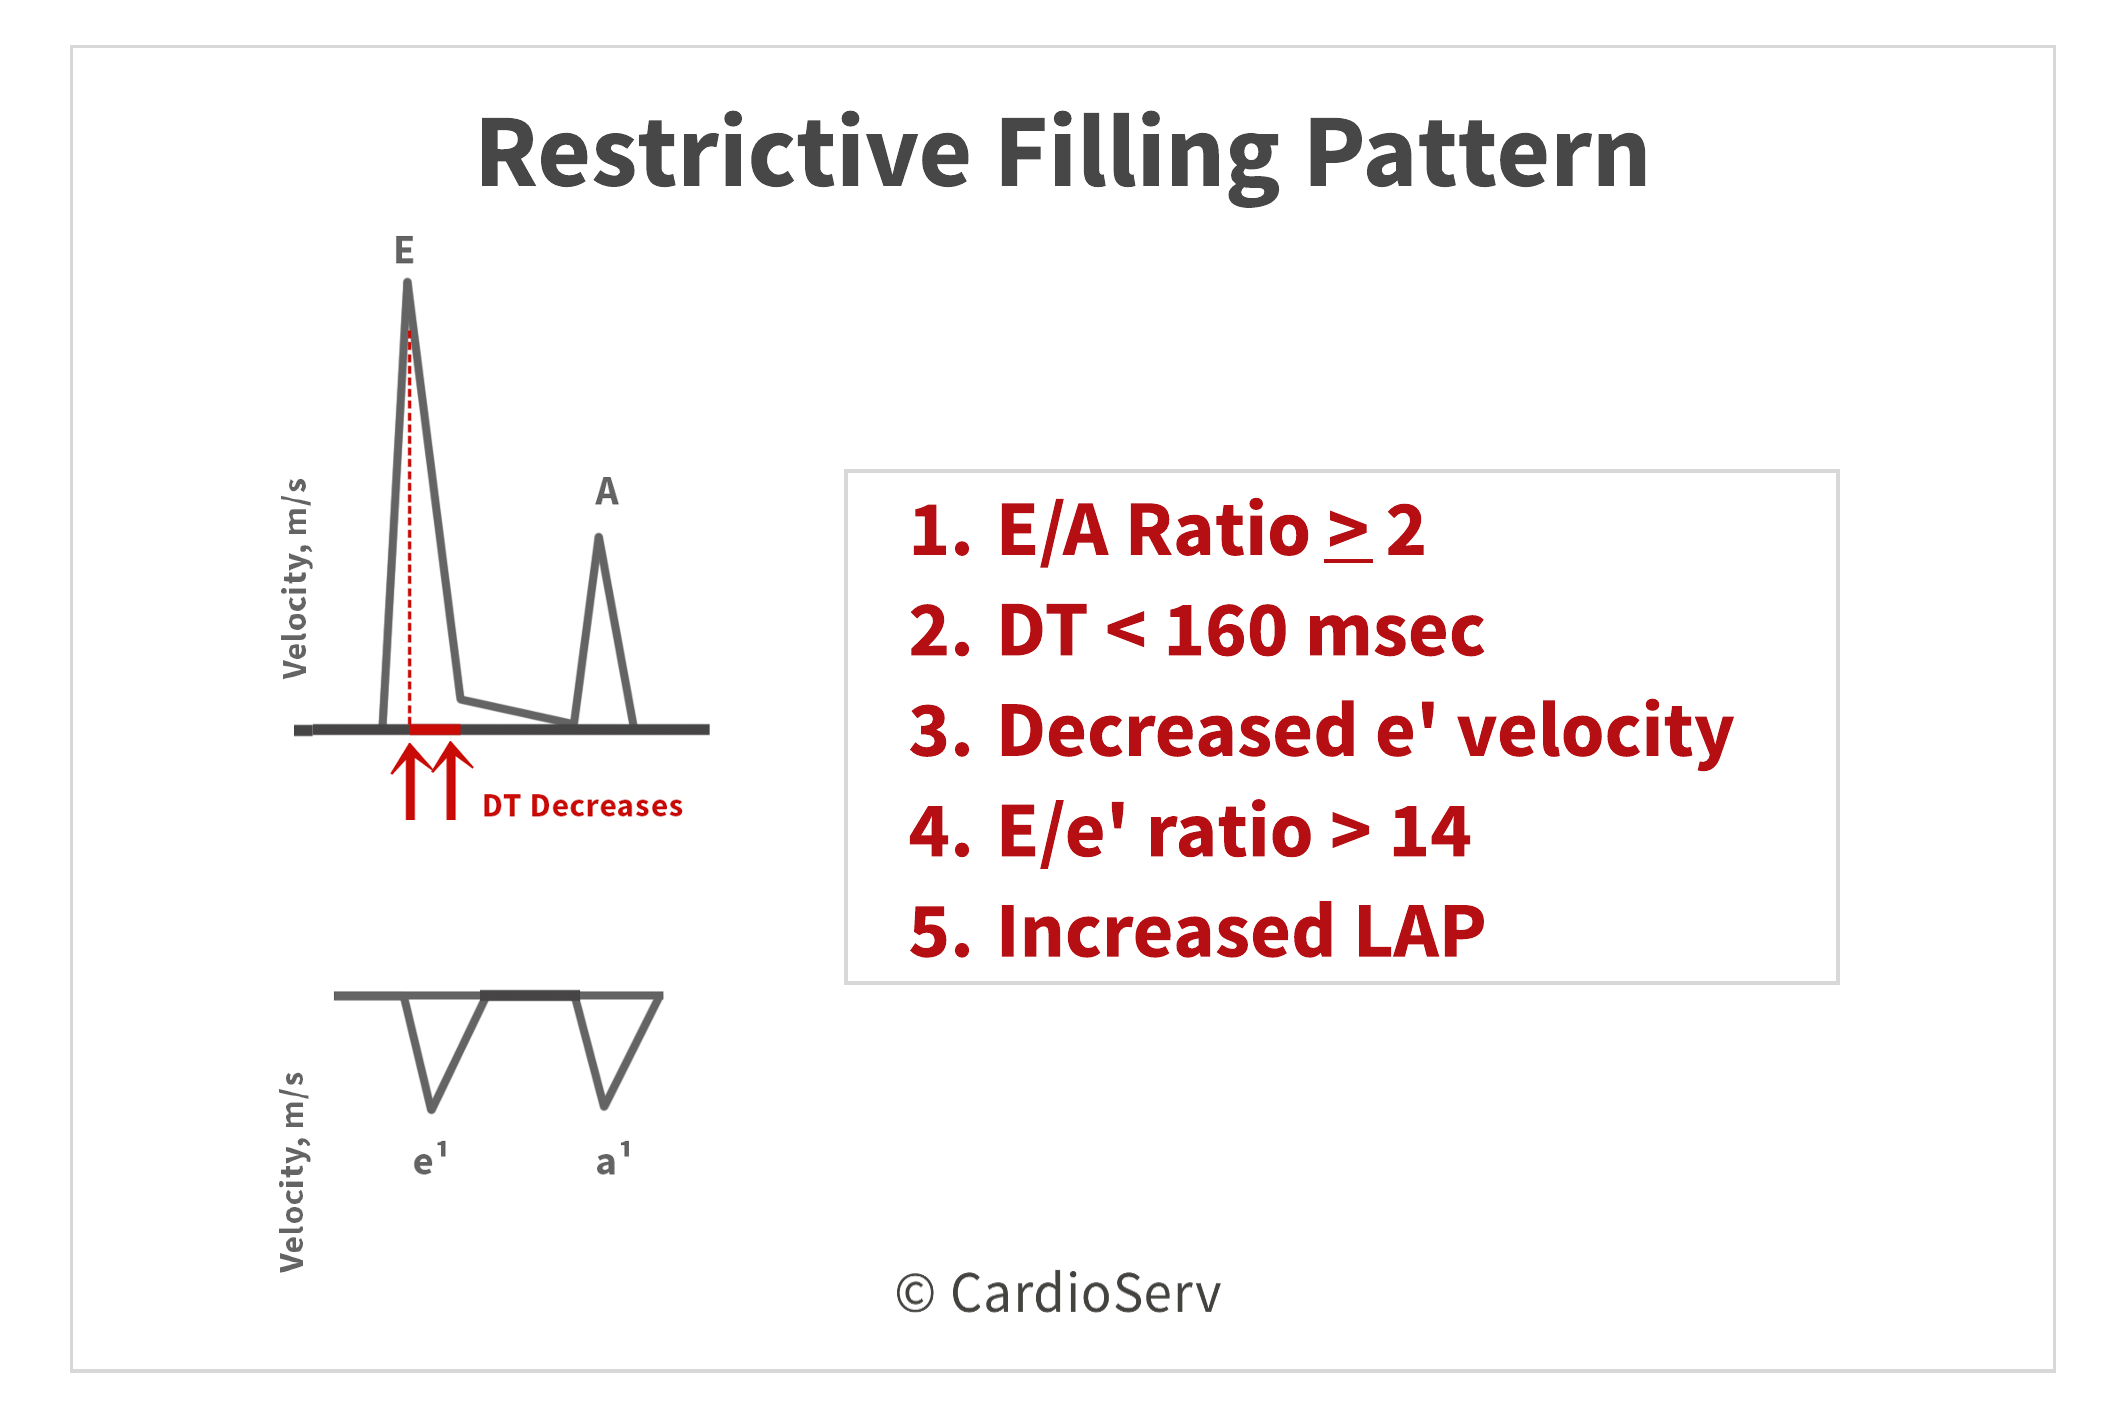
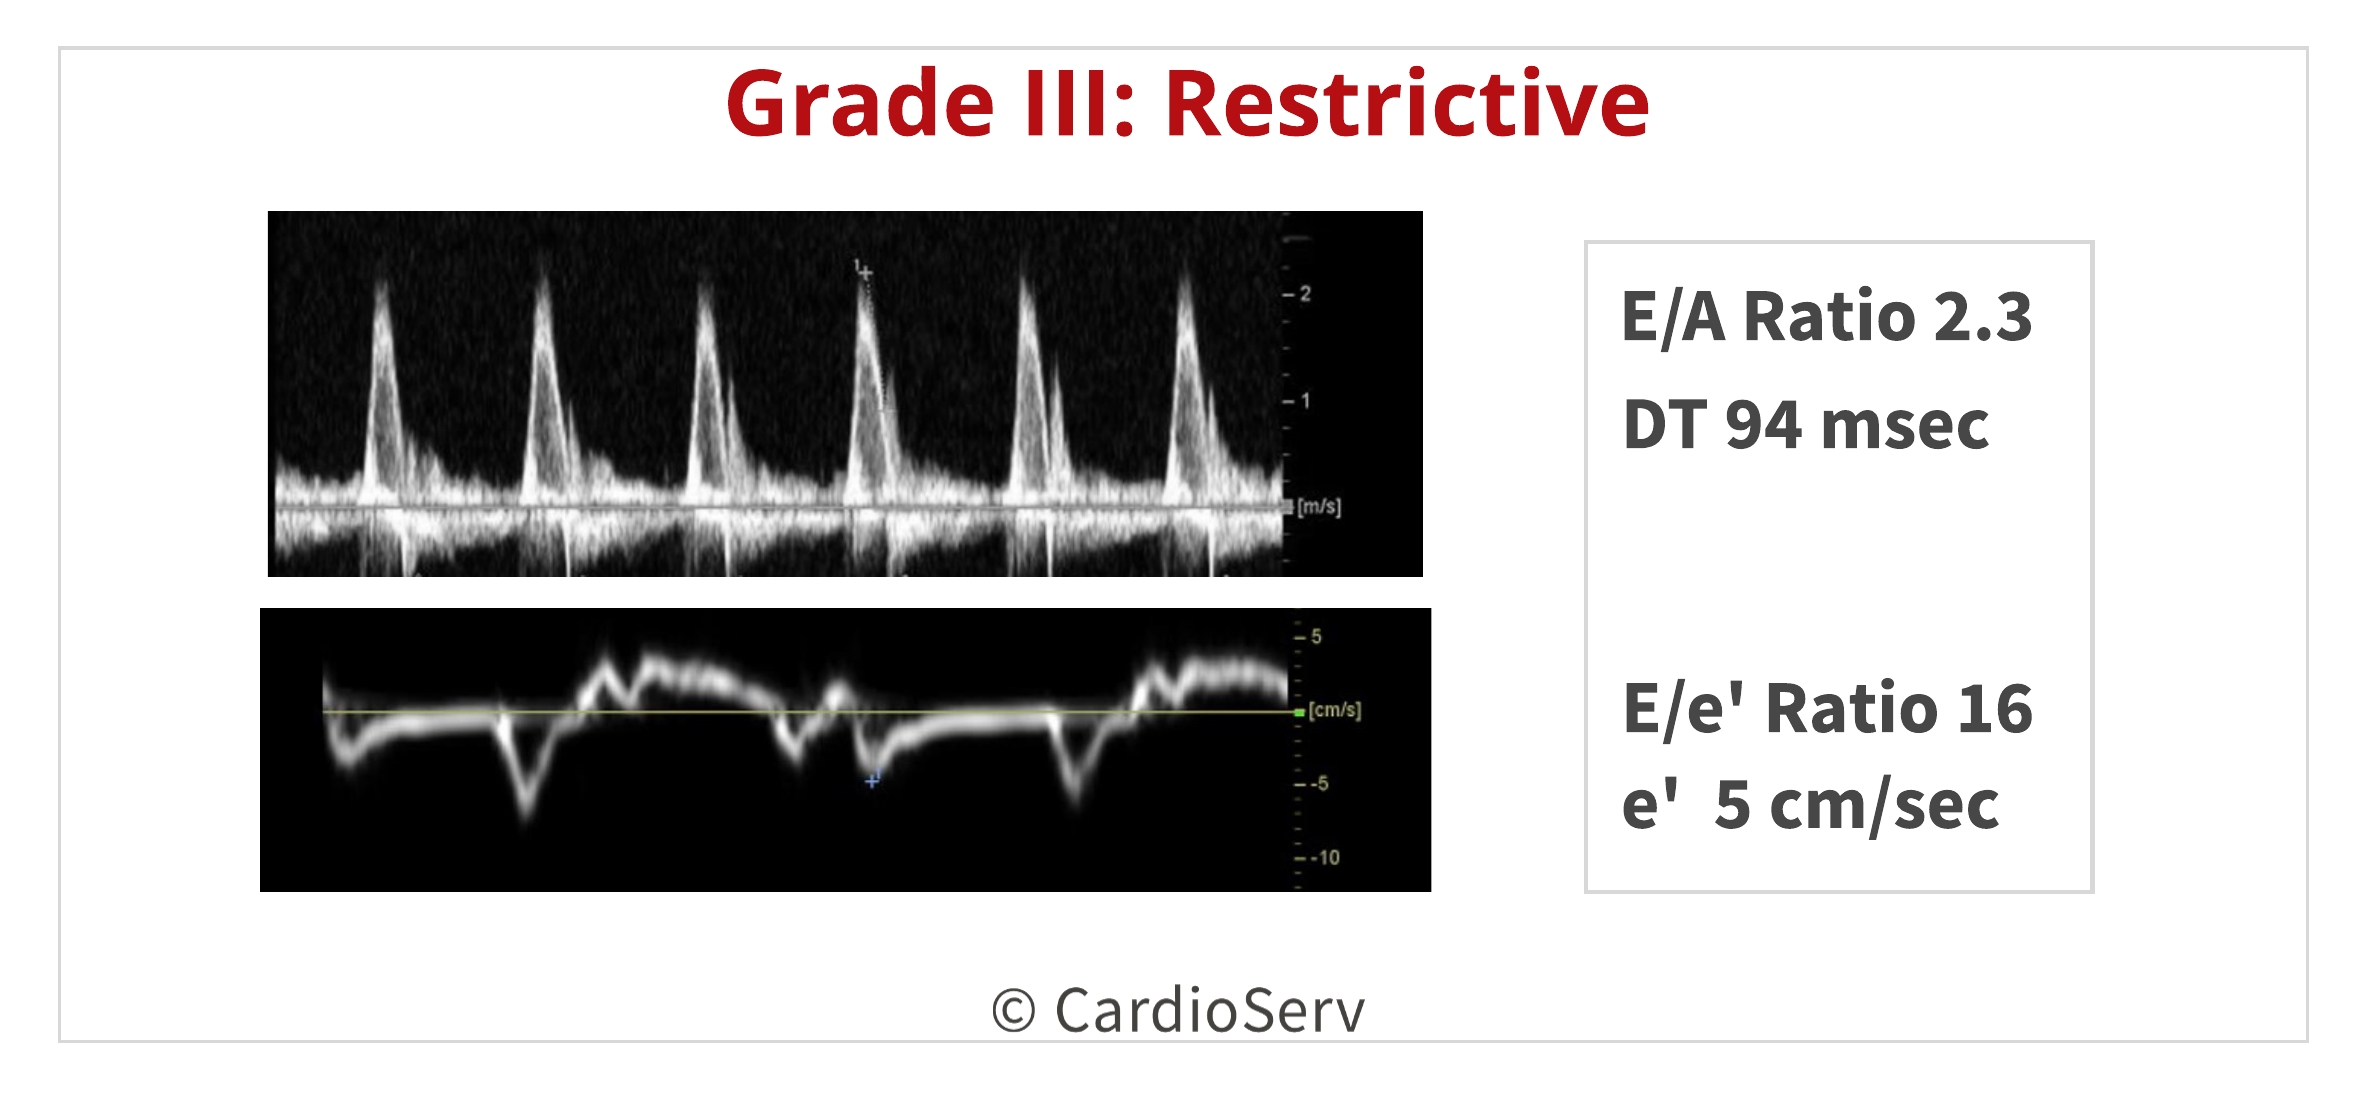
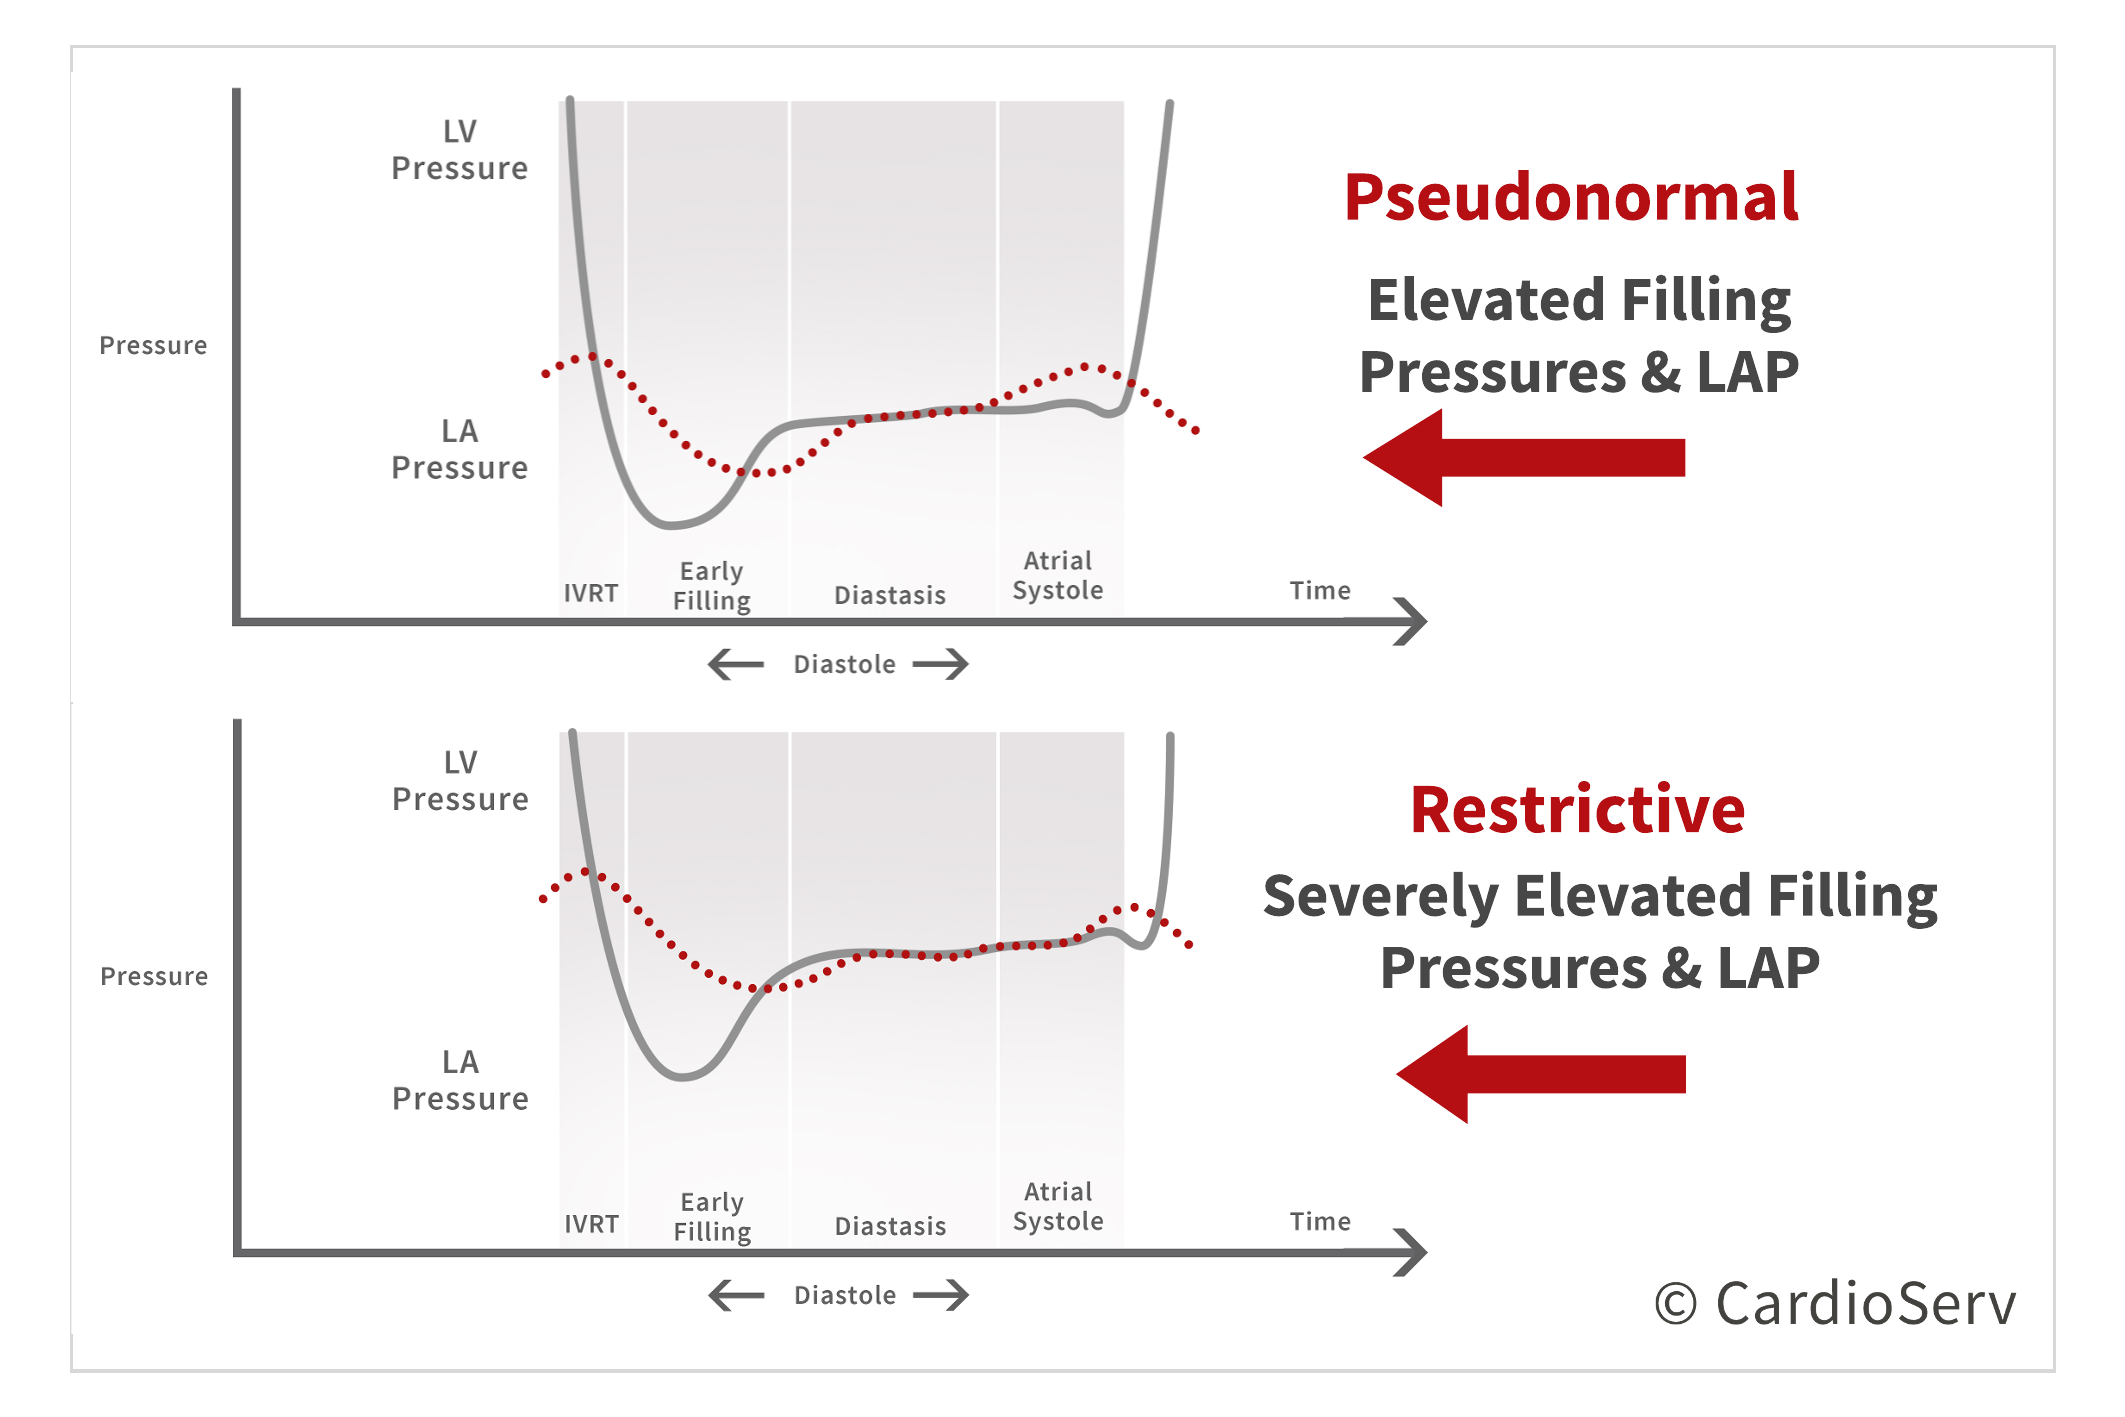
As the severity of diastolic dysfunction progressive, the heart eventually will reach the restrictive filling phase. This pattern is represented by an E/A ratio > 2, DT very short (<160 msec) and IVRT < 50 msec due to decrease in ventricle compliance and elevated filling pressures. With the LAP being elevated, the E-wave velocity will be increased but a small mitral annular e’ velocity will be present (< 3-4 cm/s).
 We can also see the pressure change between the LV and LA as the severity progresses from a pseudonormal state to restrictive.
As the severity of diastolic dysfunction progresses, we can observe the change in filling patterns across the transmitral flow due to being dependent on loading conditions. In contrast, we can also evaluate the mitral annular e’ velocity as it decreases in velocity with progression of diastolic dysfunction. Using these indexes allows us to evaluate the severity and grade of diastolic dysfunction in conjunction with presence of elevated LAP.
 Andrea Fields MHA, RDCS
Stay Connected: LinkedIn, Facebook, Twitter, Instagram
References:
Gillebert, T. C., Pauw, M. D., & Timmermans, F. (2013). Echo-Doppler Assessment of Diastole: Flow, Function and Hemodynamics. Education in Heart, 99, 55-64. Retrieved November 20, 2017, from https://pdfs.semanticscholar.org/deda/8ed40076f7bbb1da2668d190d15af9947c2d.pdf.
Nagueh, S. F., MD, Smiseth, O. A., MD, & Appleton, C. P., MD. (2016). Recommendations for the Evaluation of Left Ventricular Diastolic Function by Echocardiography: An Update from the American Society of Echocardiography and European Association of Cardiovascular Imaging. American Society of Echocardiography, 29(4), 277-314. Retrieved October 31, 2017, from http://asecho.org/wordpress/wp-content/uploads/2016/03/2016_LVDiastolicFunction.pdf
Andersen, O. S., MD, Smiseth, O. A., MD, & Dokanish, H., MD. (2017). Estimating Left Ventricular Filling Pressures by Echocardiography. Journal of the American College of Cardiology,69(15), 1937-1948. Retrieved November 29, 2017.
Mitter, S. S., MD, Shah, S. J., MD, & Thomas, J. D., MD. (2017). A Test in Content: E/A and E/e’ to Assess Diastolic Dysfunction and LV Filling Pressures. Journal of the American College of Cardiology,69(11), 1451-1464. Retrieved November 29, 2017.
Mottram, P. M., & Marwick, T. H. (2005). Assessment of Diastolic Function: What the General Cardiologist Needs to Know. Heart British Cardiovascular Journal,91, 681-695. doi:10.1136


Jan
2018