Last Updated on November 18, 2025 by Don Gerig, RDCS
In the past, we have written articles on aortic stenosis and best practices for performing the continuity equation. It’s great to read blogs but it is important to apply this knowledge to our everyday practice. That is why this week we asked experienced sonographer, Jessica Hooley, ACS, RCS, to share some real life examples of aortic stenosis and mismatch values and provide us with some tips and recommendations.
Please be sure to check out the Educator Spotlight this week to learn more about Jessica and her advanced experience within echocardiography. Take it away Jessica….
AORTIC STENOSIS AND MISMATCH VALUES
I would like to share some everyday examples and tips to help ensure our continuity equations are accurate. We all know it can be hard to get all three of our numbers (max velocity, mean gradient and AVA) to all fall into the same category of severity for AS, but there are things we can do to help optimize this and make sure we are doing our best to quantify aortic stenosis.
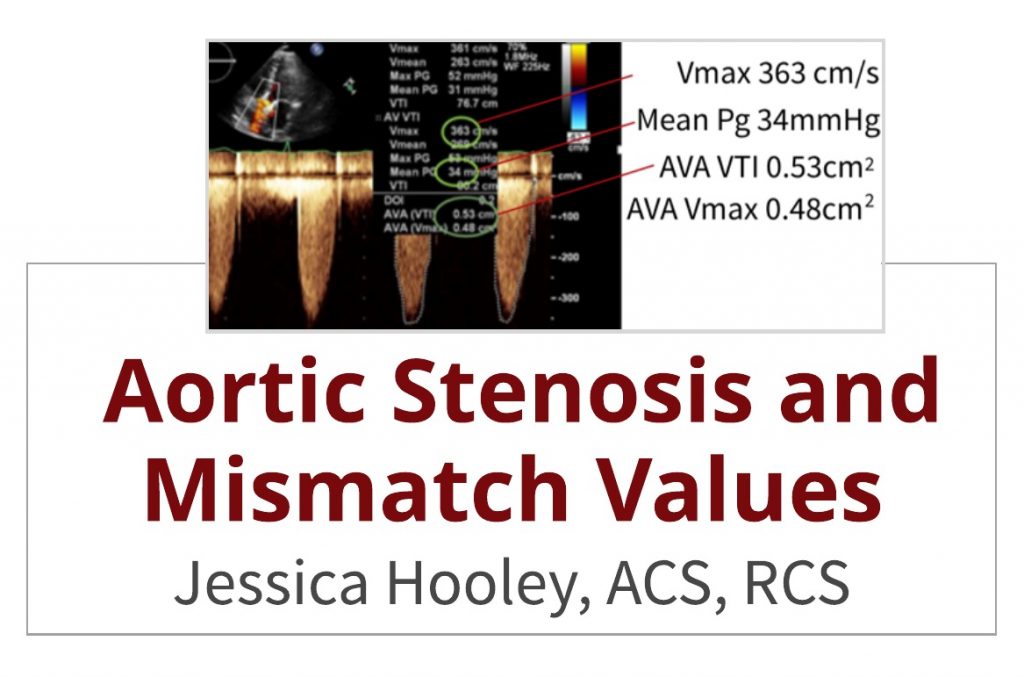
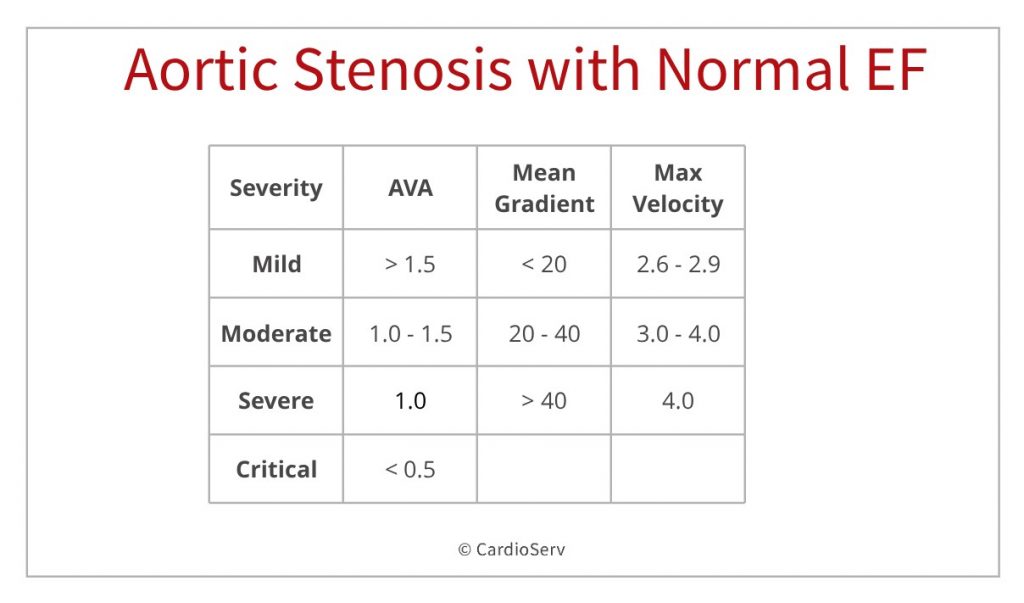
CASE STUDY: AORTIC STENOSIS WITH NORMAL EF.
Is this severe aortic stenosis by Doppler criteria?
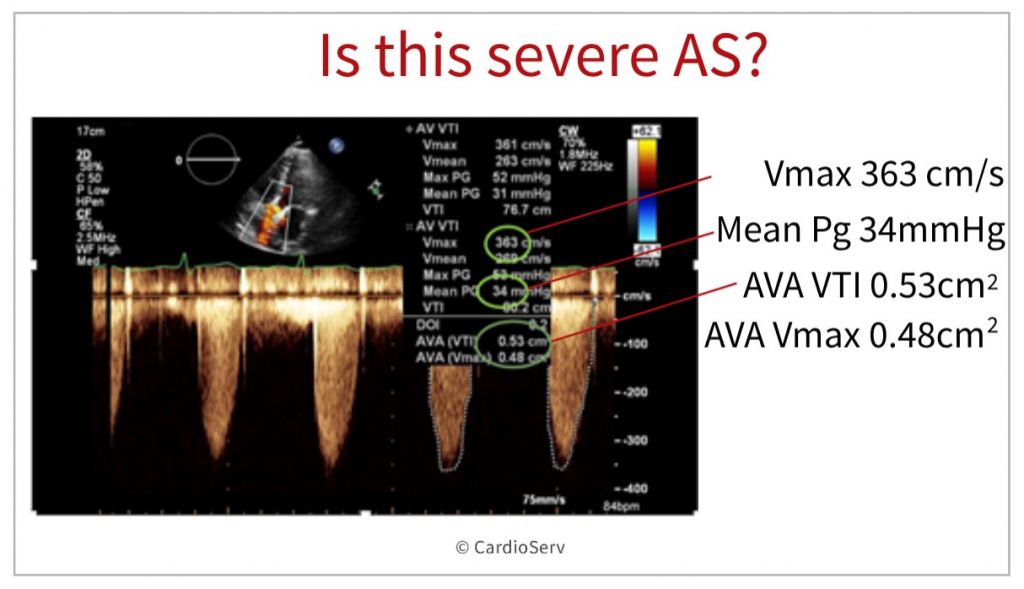
Lets first assess the values obtained in this image. Below is the reference table to refresh your memory.
- AVA Vmax = 0.48 cm2 = critical AS
- AVA VTI = 0.53 cm2 = severe AS
- Mean PG = 34 mmHg = moderate AS
- Max Velocity = 3.6 m/sec2 = moderate AS
So…which one is it? Severe or moderate aortic stenosis? Whenever we are faced with discordance of data, it is important to always first rule out any possible errors.
Aortic Stenosis and Mismatch Values: 2 Pitfalls to avoid
1. Under-measuring the LVOT
- If the LVOT diameter is measured too small it will affect the calculated AVA and produce an inaccurate and smaller AVA value. (exaggerating the degree of stenosis). Remember that the LVOT is squared in the continuity equation and even small changes in the LVOT diameter size have a significant impact on the calculated AVA.
- Likewise, over-measuring the LVOT will produce a larger AVA (under-call AS stenosis).
2. Poor Doppler alignment
- When there is not proper alignment with the valve during CW Doppler assessment, the true gradient can be missed and under-called.
- Tips to avoid missing the true gradient include: making sure you are aligned parallel to the flow through the aortic valve by imaging more lateral, and ensuring you have a CW signal that is dense and completely filled in. Remember, you do not have to have a great image to get great Doppler.
BACK TO THE CASE STUDY
With these pitfalls in mind, let’s return back to the case study. In reviewing images from the case study, we were able to rule out Doppler alignment errors. The spectral Doppler looked to have proper Doppler alignment and the spectral tracing was dense and filled in.
Next, we then assessed the LVOT diameter. How accurately was the LVOT diameter measured?
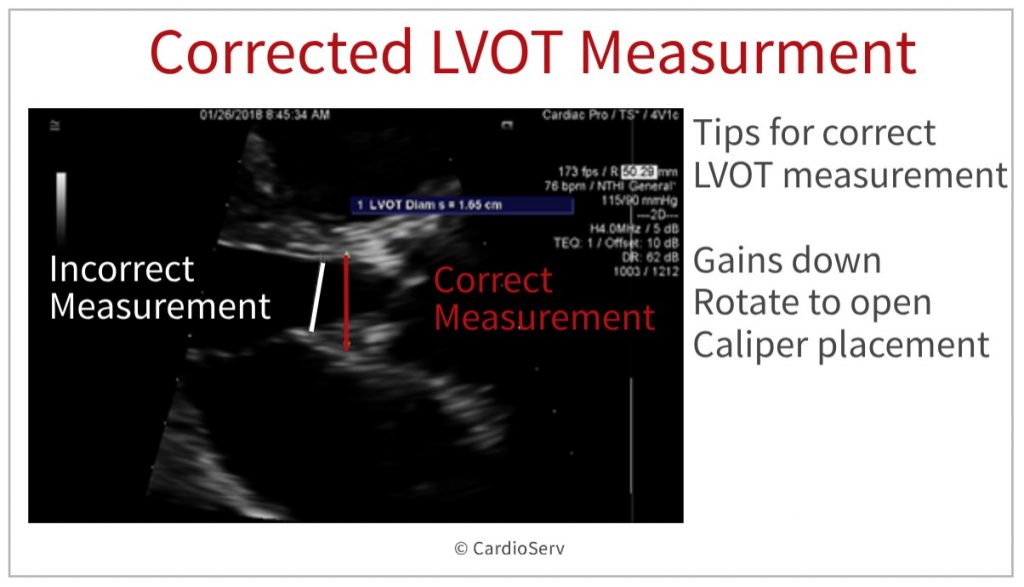
LVOT MEASUREMENT ERROR
After reviewing the echo, the LVOT diameter was found to be the culprit.
- By turning the gains down, opening up the LVOT and using better caliper placement the LVOT was accurately measured.
- Just those little changes allowed the LVOT diameter to be measured correctly (2.1cm instead of the under-measured 1.65cm).
- By correcting the LVOT diameter, this brought the calculated valve area above 1cm2 and in the moderate range which correlated with the spectral Doppler findings.
WHY DOES THE LVOT DIAMETER AFFECT THE AVA SO GREATLY?
AVA Calculation by continuity equation
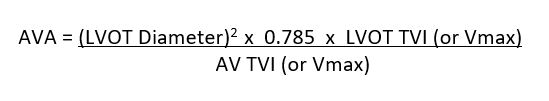
I know, back to school, but this equation is very important to remember!! You can review an in-depth review of the continuity equation from a previous blog article here. The additional tips that I would like to provide include an easy way to help you figure out HOW these numbers affect your AVA.
TIP: Every value on the top line of the equation has a direct relationship to the valve area.
- This means that if one of the measurements is increased (or larger), the calculated valve area will increase.
- Likewise, if one of these measurements are decreased (or smaller), the calculated valve area will decrease
- The LVOT diameter is squared in this equation so small changes in this value has large implications!
- If you have discordance with your data, go back and check for errors and re-measure as needed.
- Note: 0.785 is a constant number included in the continuity equation
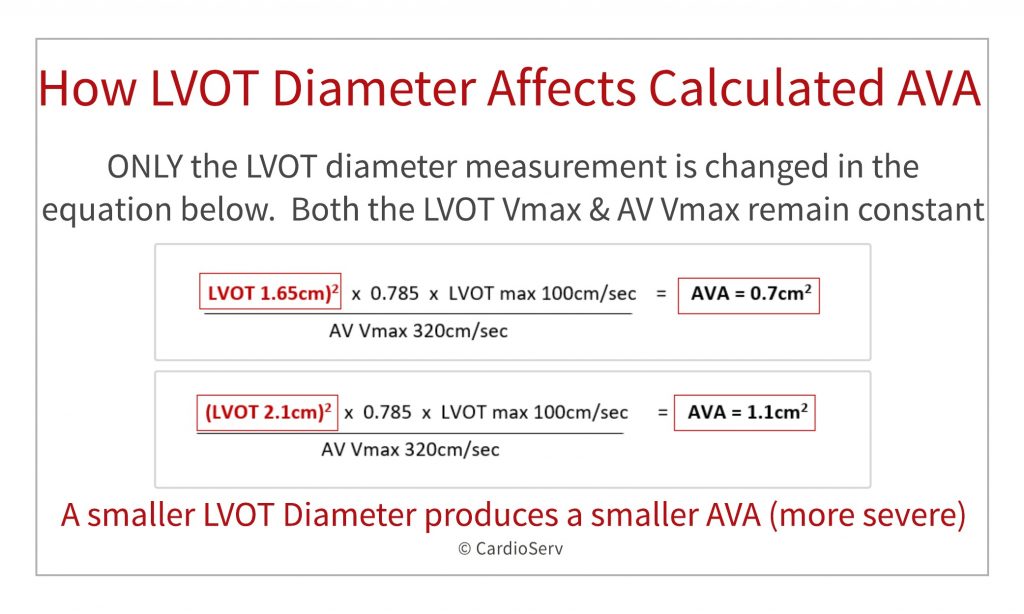
EXAMPLES OF LVOT DIAMETER CHANGE IN SIZE AND HOW IT AFFECTS THE AVA.
Below demonstrates just how much a change in the LVOT affects the calculated AVA. This example is similar to our case study. Both examples have Doppler values that fall in the moderate stenosis range. Let’s see what happens when we change only the LVOT diameter value!
- AVA = 0.7 cm2 (LVOT 1.65cm)2 X 0.785 X 100cm/ 320cm/sec
- AVA = 1.1 cm2 (LVOT 2.1cm)2 X 0.785 X 100cm/sec / 320cm/sec
Wow, by increasing the LVOT diameter value from 1.65cm to 2.1cm, we see how the calculated AVA increased from a 0.7cm2 (severe AS) to 1.1cm2 (moderate AS)!! I hope this helps show the importance of obtaining an accurate LVOT diameter measurement.
TIPS FOR ACCURATE LVOT MEASUREMENT:
You can view past blogs on accurate LVOT assessment here. From my experience, I have found the following tips helpful in optimizing the image prior to measuring the LVOT:
- Zoom on the valve.
- Bring the focus to the level of the valve.
- Use small rotations to open the valve as much as possible.
- Optimize gains
- Turning down gains can help define the true edge vs just fuzz or haze from having the gains too bright.
- Also, by turning your gains down for this measurement, you will create distinct lines to help you measure especially on the heavily calcified valves.
- Measure during mid systole and inner to inner edge.
EXAMPLES OF IMAGE OPTIMIZATION
Reducing LVOT Gains
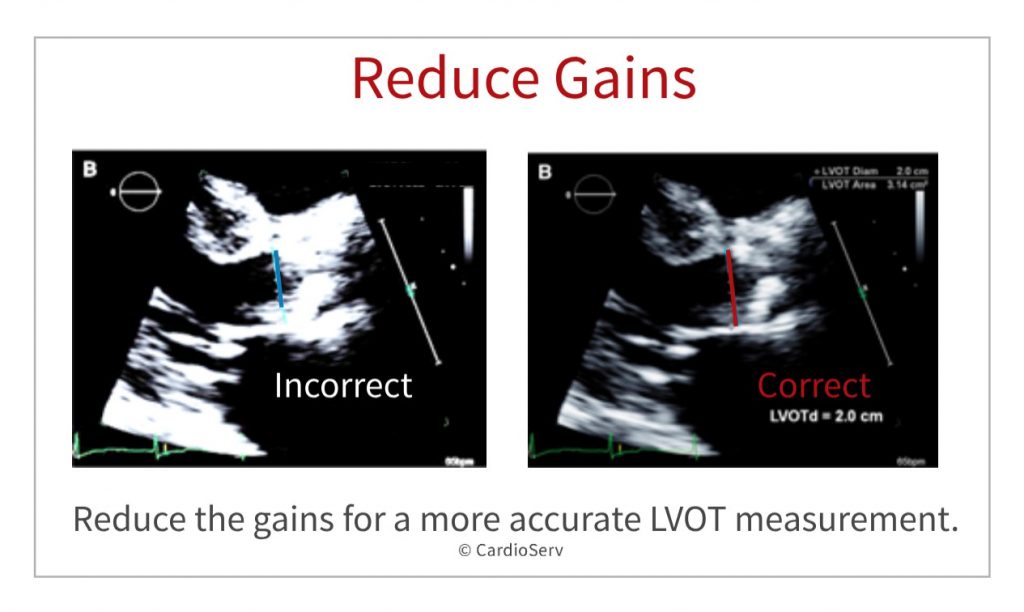
In this image, we see how the gains were way too bright making it hard to accurately measure the true LVOT diameter. The LVOT was UNDER-measured. How will this affect my calculated AVA? Remember my continuity trick! The LVOT has a direct relationship with the AVA. If the LVOT is under-called (measured smaller than it actually is) then the calculated AVA will also be calculated smaller than it really is. This gives the false impression of stenosis or exaggerates the severity of stenosis. By turning the gains down and reducing the noise, it became easier to measure accurately.
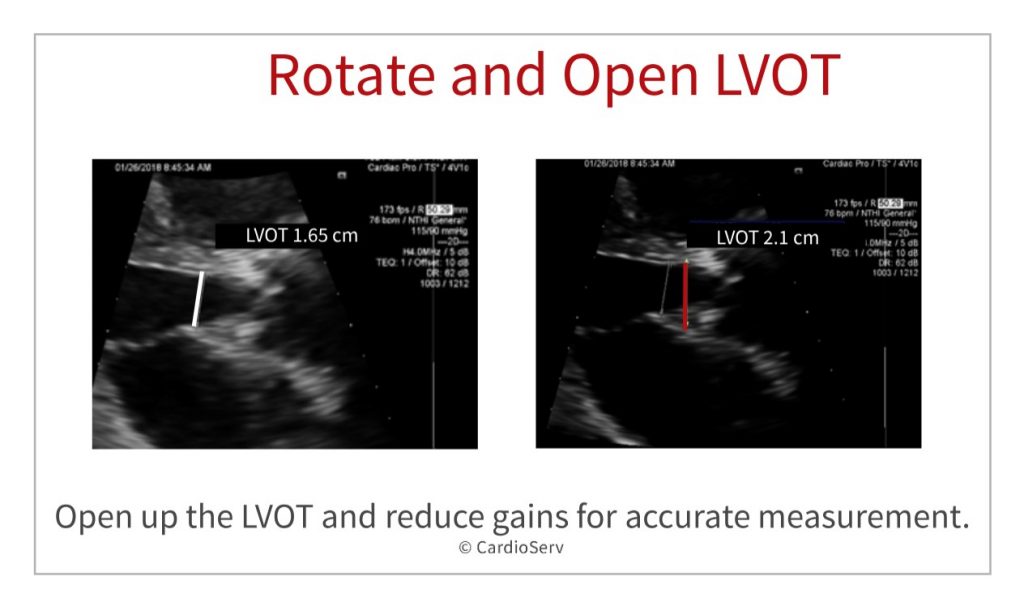
Rotate and Open the LVOT
In this image we see once again, the LVOT diameter was measured too small. The gains are too bright, and a little rotation would have opened the valve more. You can also see how the LVOT was measured too far into the ventricle and should have been measured closer to the valve.
SUMMARY
As you can see, calculating aortic stenosis takes very precise, accurate measurements. I hope my tips helped as I know sometimes AS can be challenging to assess accurately!
Key points:
- The LVOT is squared in the continuity equation and has a profound affect on the calculated AVA.
- The LVOT is directly related to the AVA size. If you under-call your LVOT, the calculated AVA will be smaller than reality, creating a false aortic stenosis value.
- Always look at your numbers as you are scanning. If there is a mismatch, rule out operator error.
- Turning down the gains and rotating to open up the LVOT can help with accuracy.
Taking these precautions helps ensure a correct diagnosis so the patient can have the treatment and procedures they need for optimal outcomes.
Other articles related to Aortic Stenosis:
- Aortic Stenosis: Breaking Down the Continuity Equation
- Top 5 Factors to Consider when Evaluating for AS
- Aortic Stenosis Low Flow, Low Gradient: What’s the hype?
- How to Master Aortic Measurements with these 5 Techniques
- 4 Errors to Avoid when Measuring aortic velocity
- Back to Basics: Aortic Valve Anatomy
- Additional Methods for Evaluating the AVA

Jessica Hooley, ACS, RCS
Connect with Jessica on LinkedIn