Last Updated on January 30, 2024 by Hannes van der Merwe
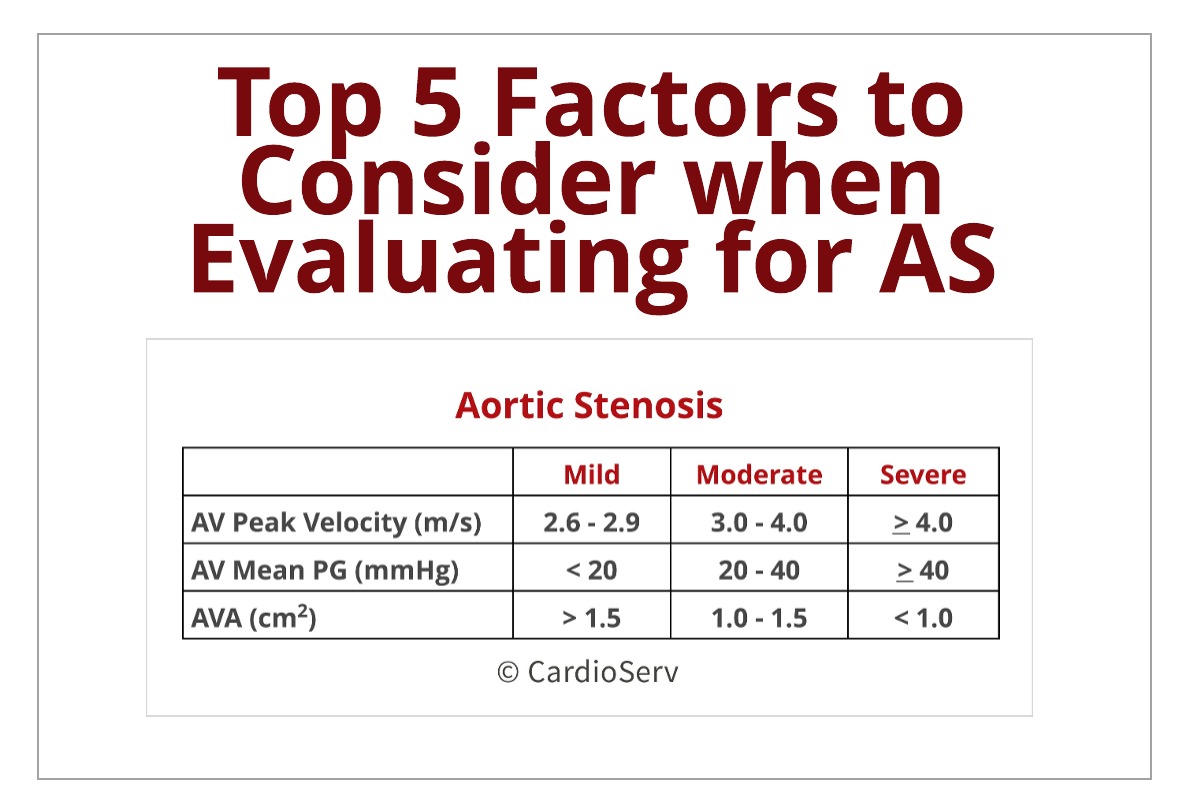
Last week we broke down the methodology of the continuity equation to calculate the aortic valve area (AVA). If you missed it, you can find it HERE. The ASE guideline recommends using the continuity equation calculated AVA, peak aortic jet velocity and mean pressure gradient to evaluate and determine the severity of aortic stenosis (AS) present. These 3 parameters can easily be affected by hemodynamics and the patients physiological state. This blog is going to discuss how certain hemodynamic and physiological states can alter the 3 parameters.
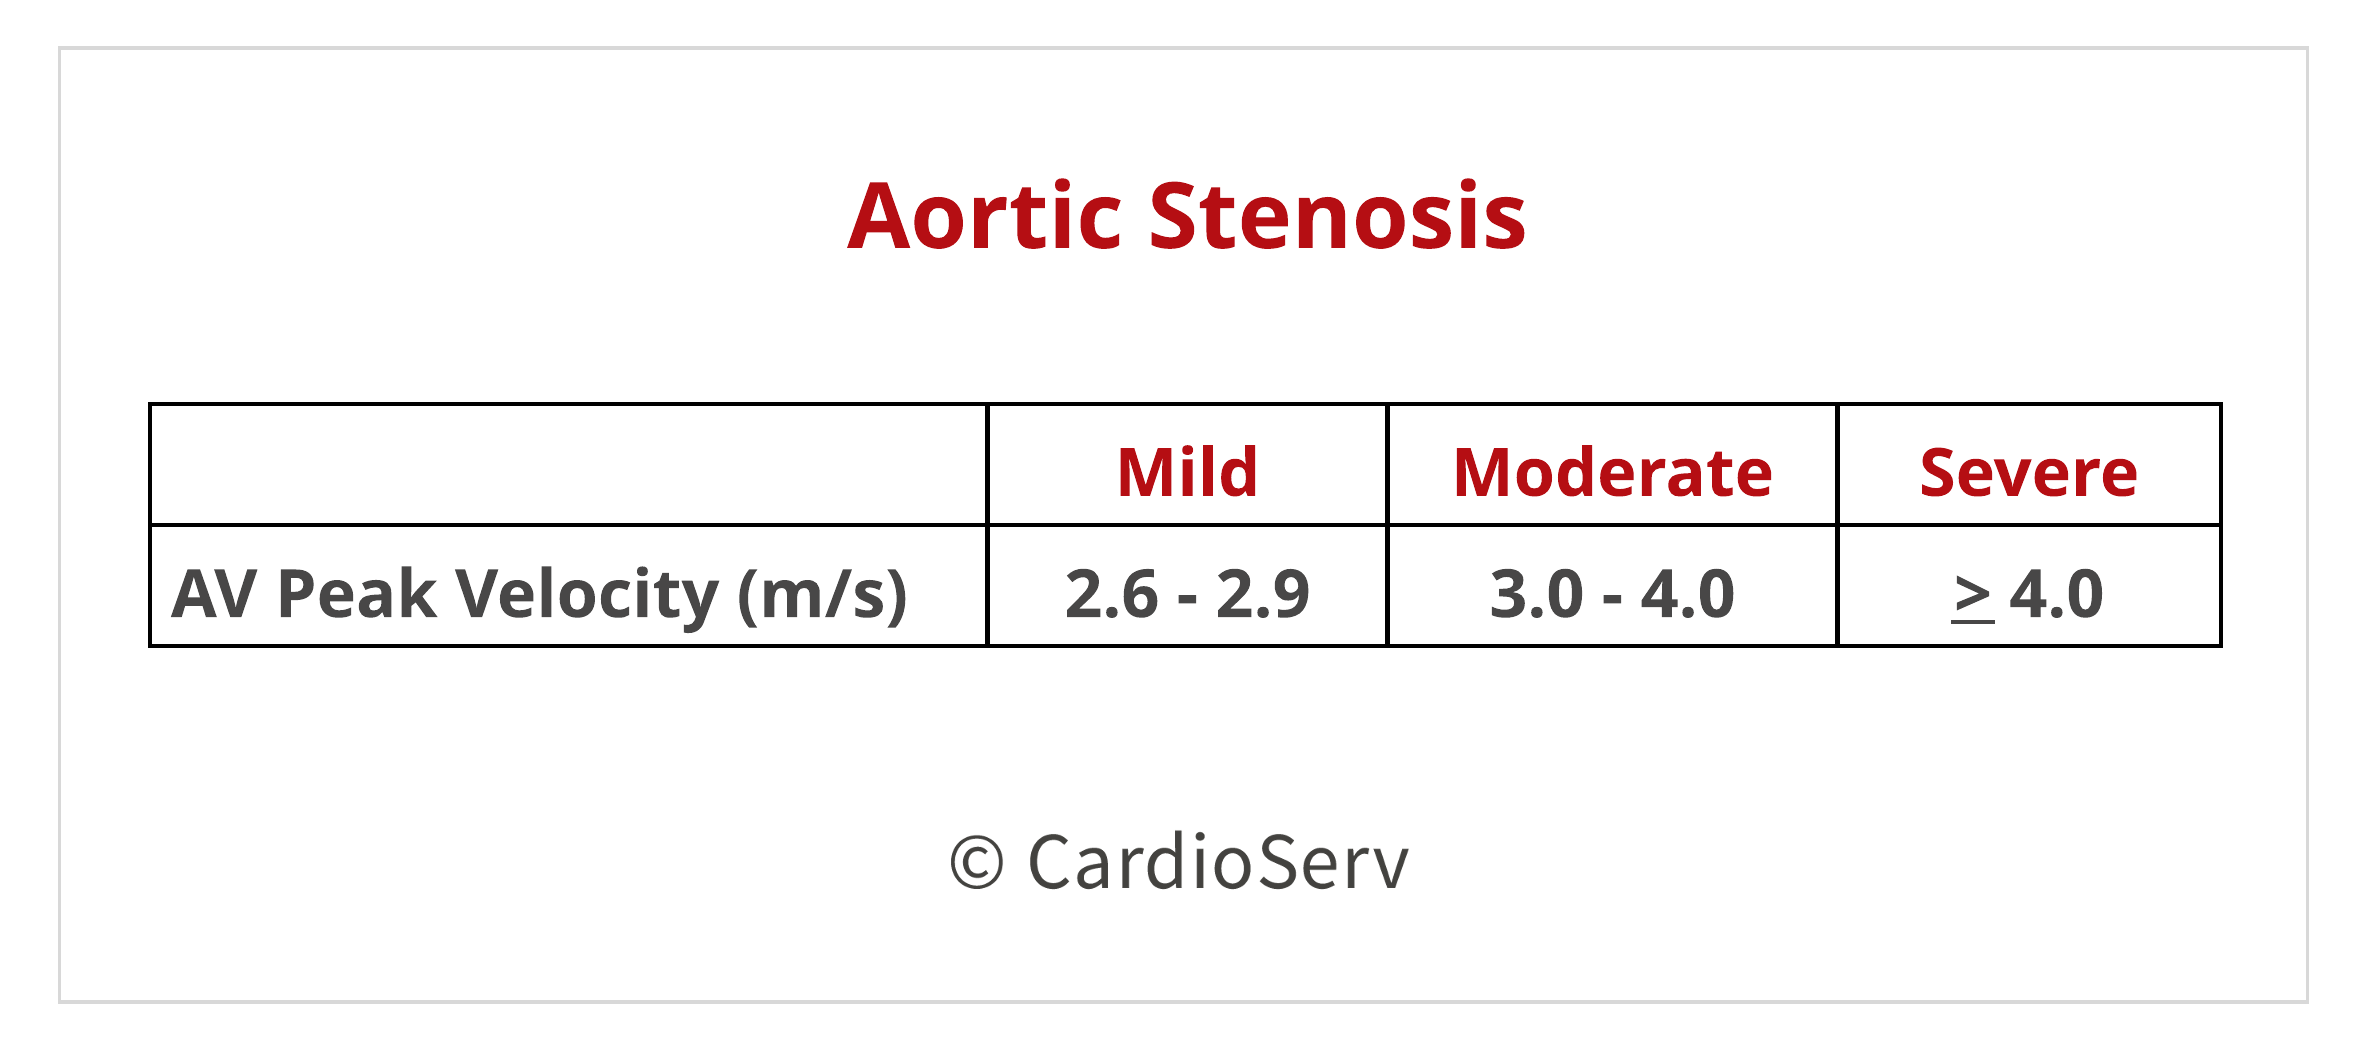
AS JET VELOCITY
The AS jet velocity is a direct measurement of the highest antegrade systolic velocity signal across the aortic valve.
Our machines measure velocity from the Doppler shift concept, which assumes the ultrasound beam is parallel to the direction of blood flow. The jet velocity through the stenotic valves can be eccentric depending on the morphology and calcification. Since we cannot visualize the valve in 3D to place the CW Doppler beam directly parallel to the flow, we much evaluate the velocity in multiple acoustic windows.
- A Doppler angle >20° will significantly underestimate the true velocity.
- ASE recommends NOT using angle correction when evaluating the AS jet velocity due to probability of causing more error.
A velocity >4 m/s is suggestive of severe aortic stenosis. The measured VTI of the AS jet velocity provides information of the peak systolic velocity, mean pressure gradient and continuity equation.
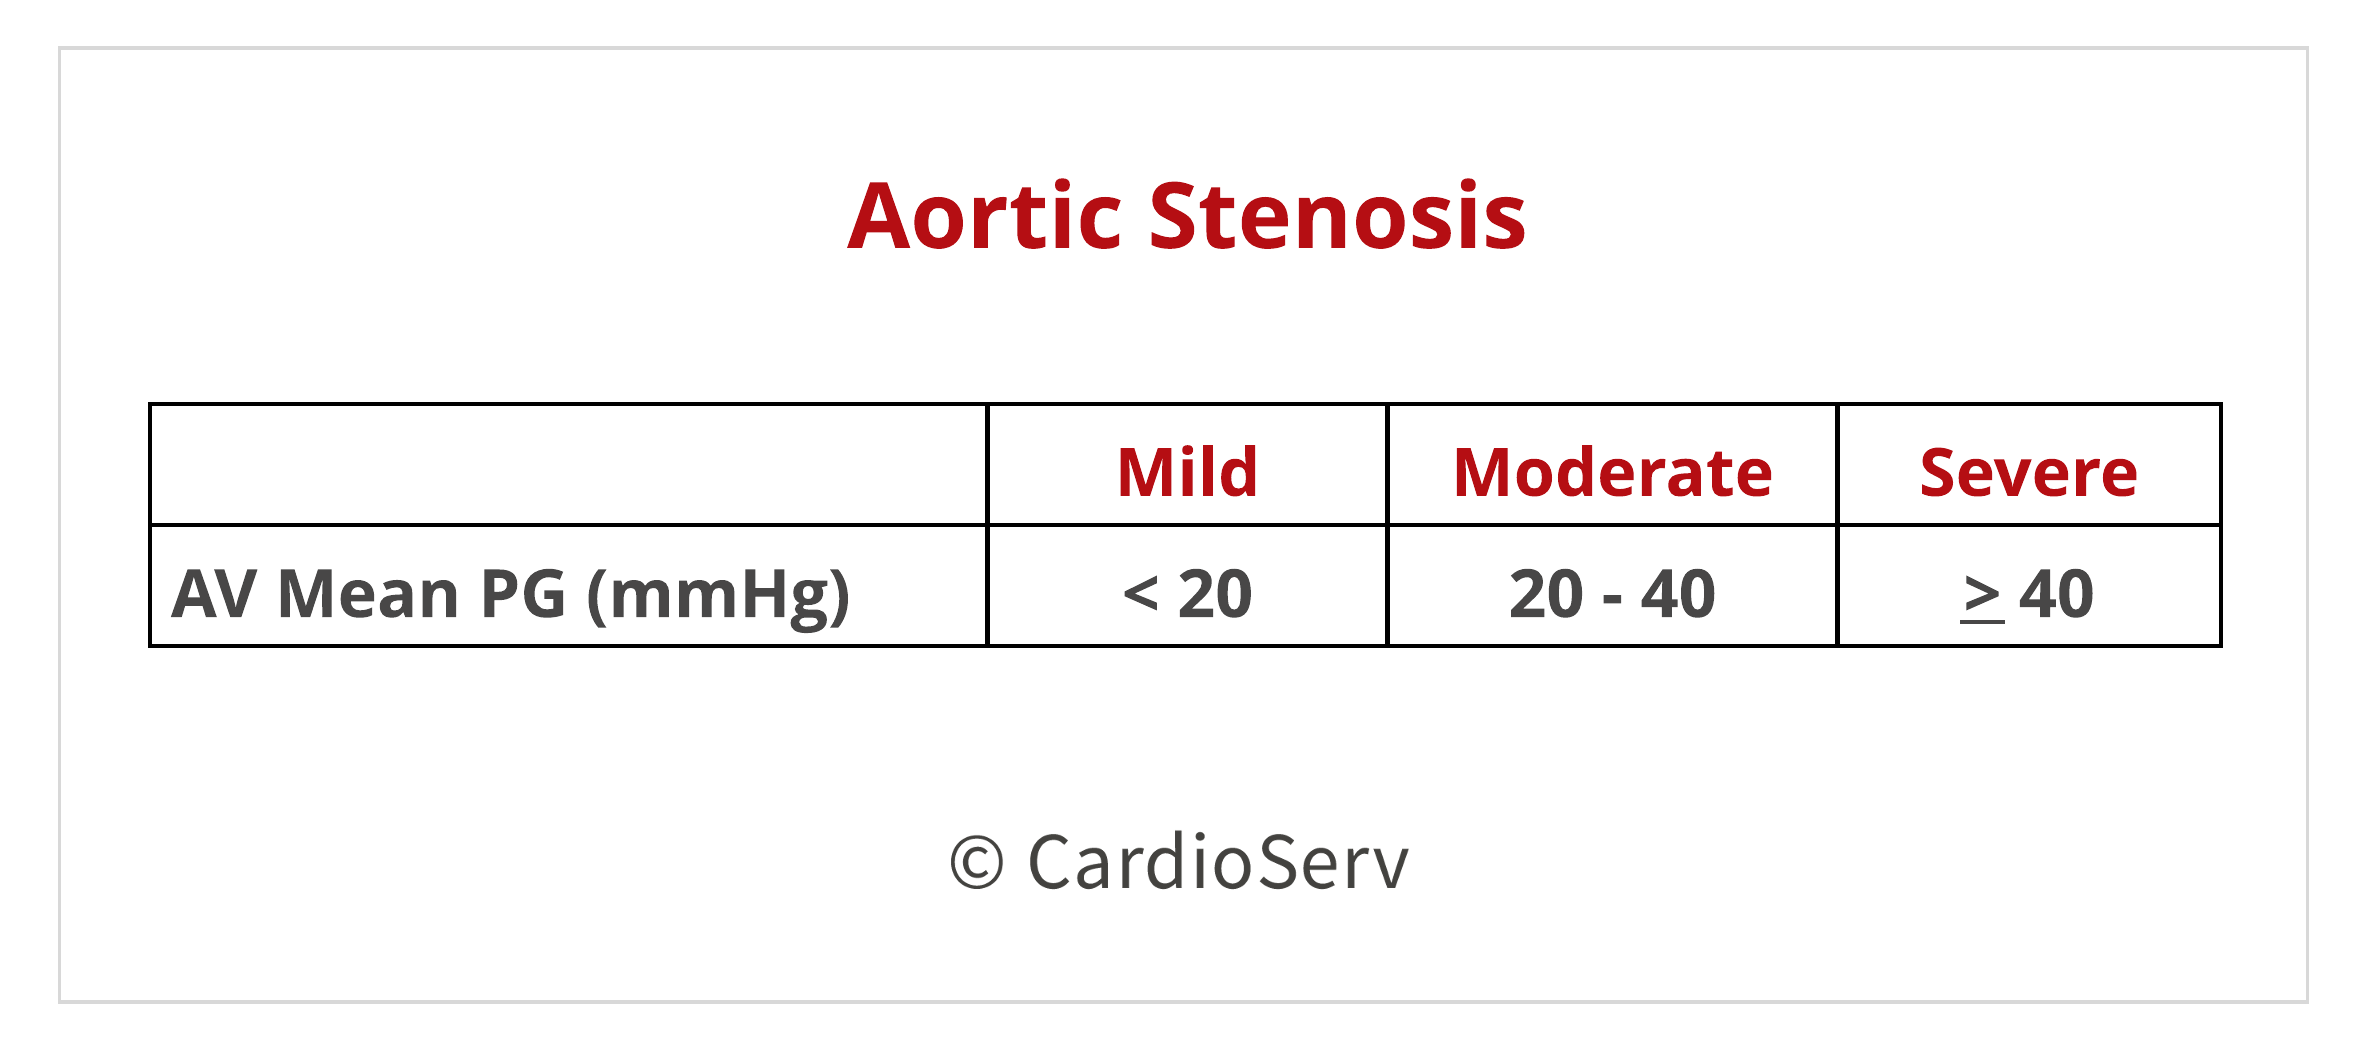
MEAN PRESSURE GRADIENT
The mean pressure gradient (PG) is another essential parameter when evaluating the severity of aortic stenosis. The pressure gradient informs us of the pressure difference between the left ventricle (LV) and aorta during systole. From the velocity-time interval (VTI) tracing of the AS jet velocity, the machine calculates the peak/maximum and mean pressure gradients.
The peak/maximum pressure gradient does not provide additional information that the peak velocity already gives us. The mean pressure gradient is the average instantaneous gradient across the valve during the entire systolic ejection period. The peak velocity and mean pressure gradient are strong predictors of clinical outcome.
A mean PG > 40 mmHg is suggestive of severe aortic stenosis.
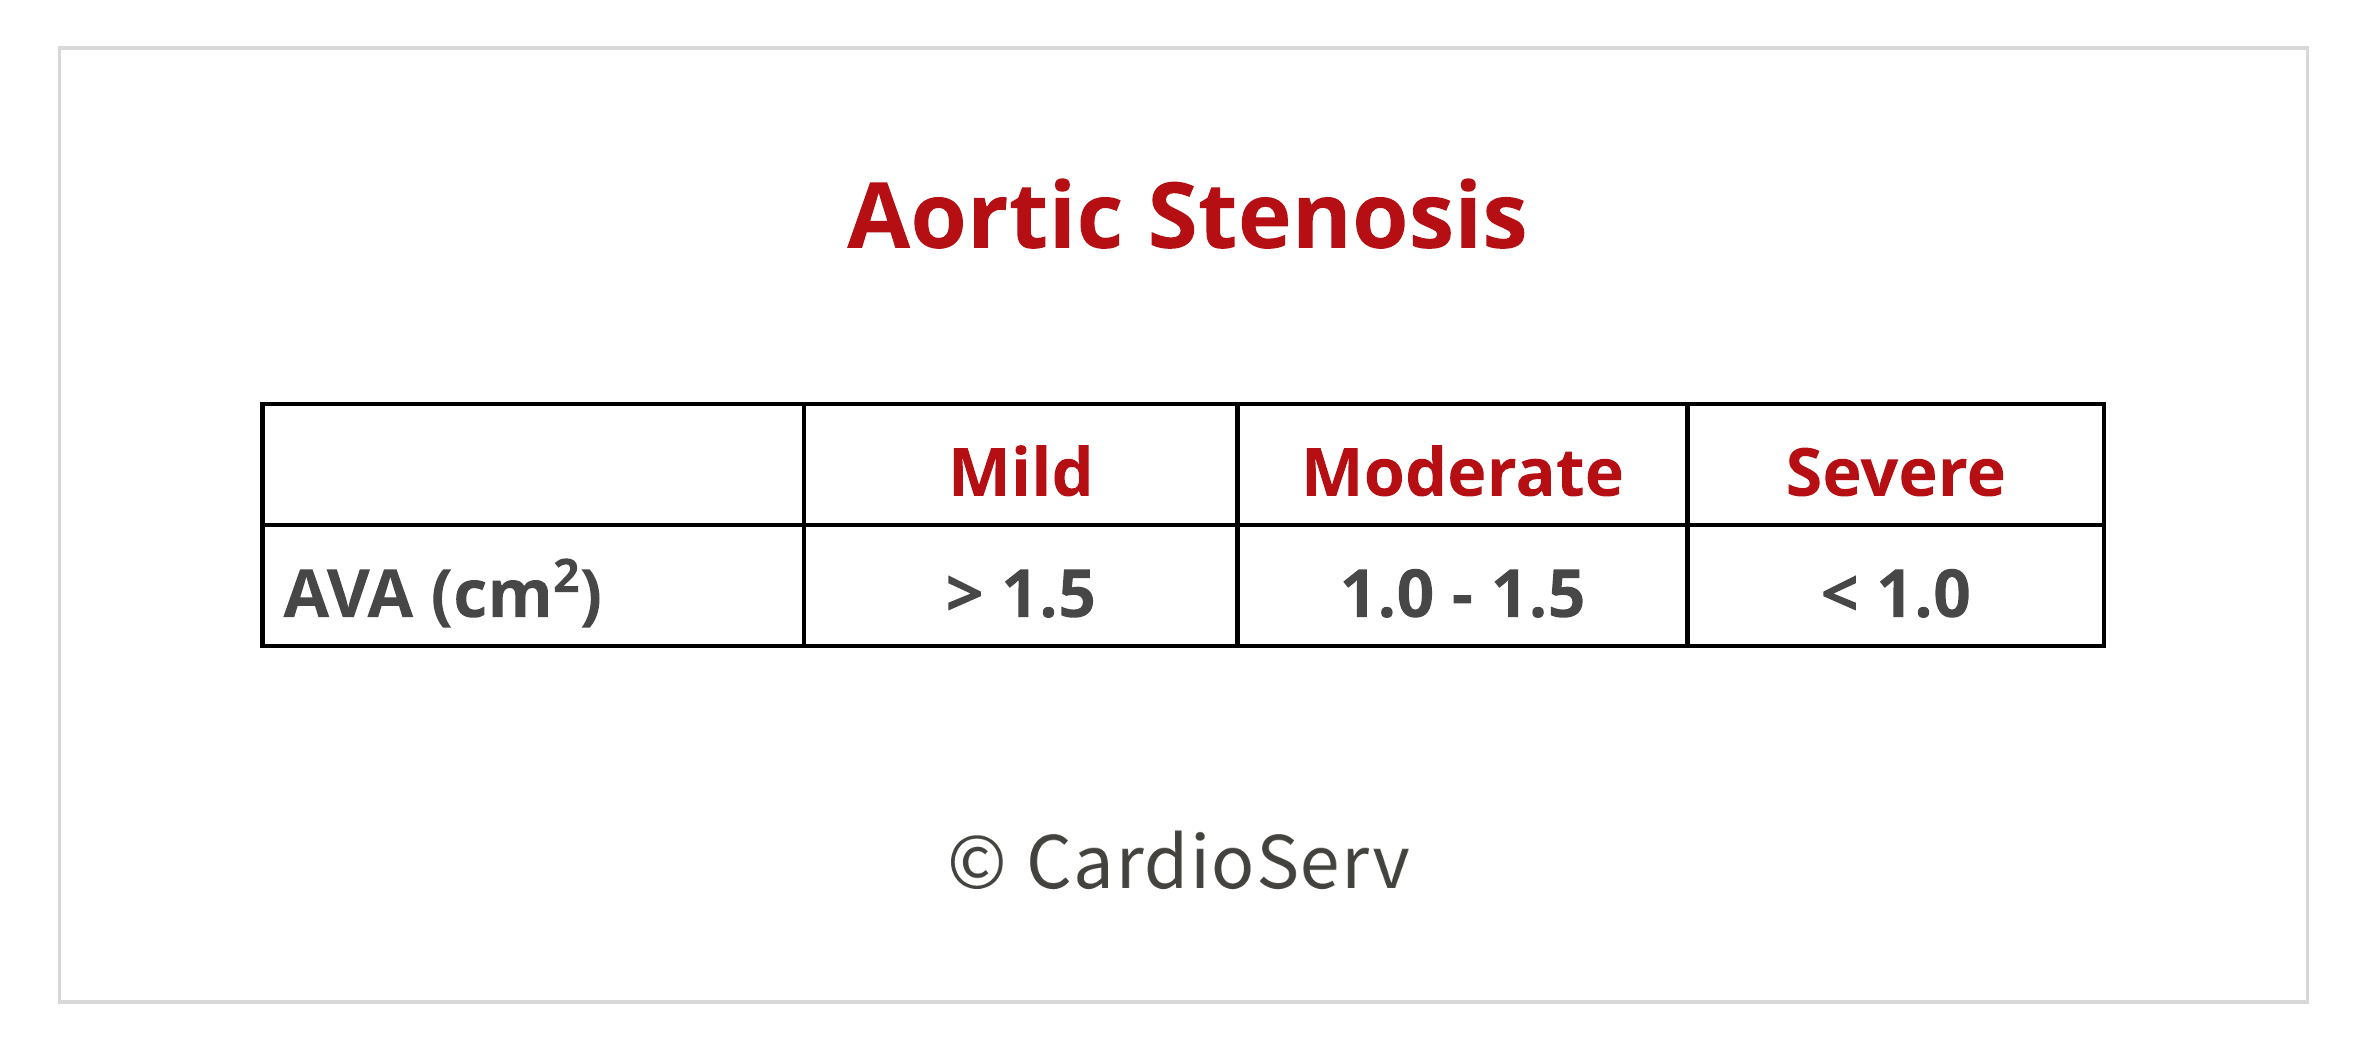
AVA BY CONTINUITY EQUATION
The continuity equation is based off the principle of mass- what goes in, must come out. We broke down this equation and steps to calculating last week- you can read it HERE. The calculated AVA is predictable for clinical outcomes and clinical decision making.
FLOW DEPENDENCY
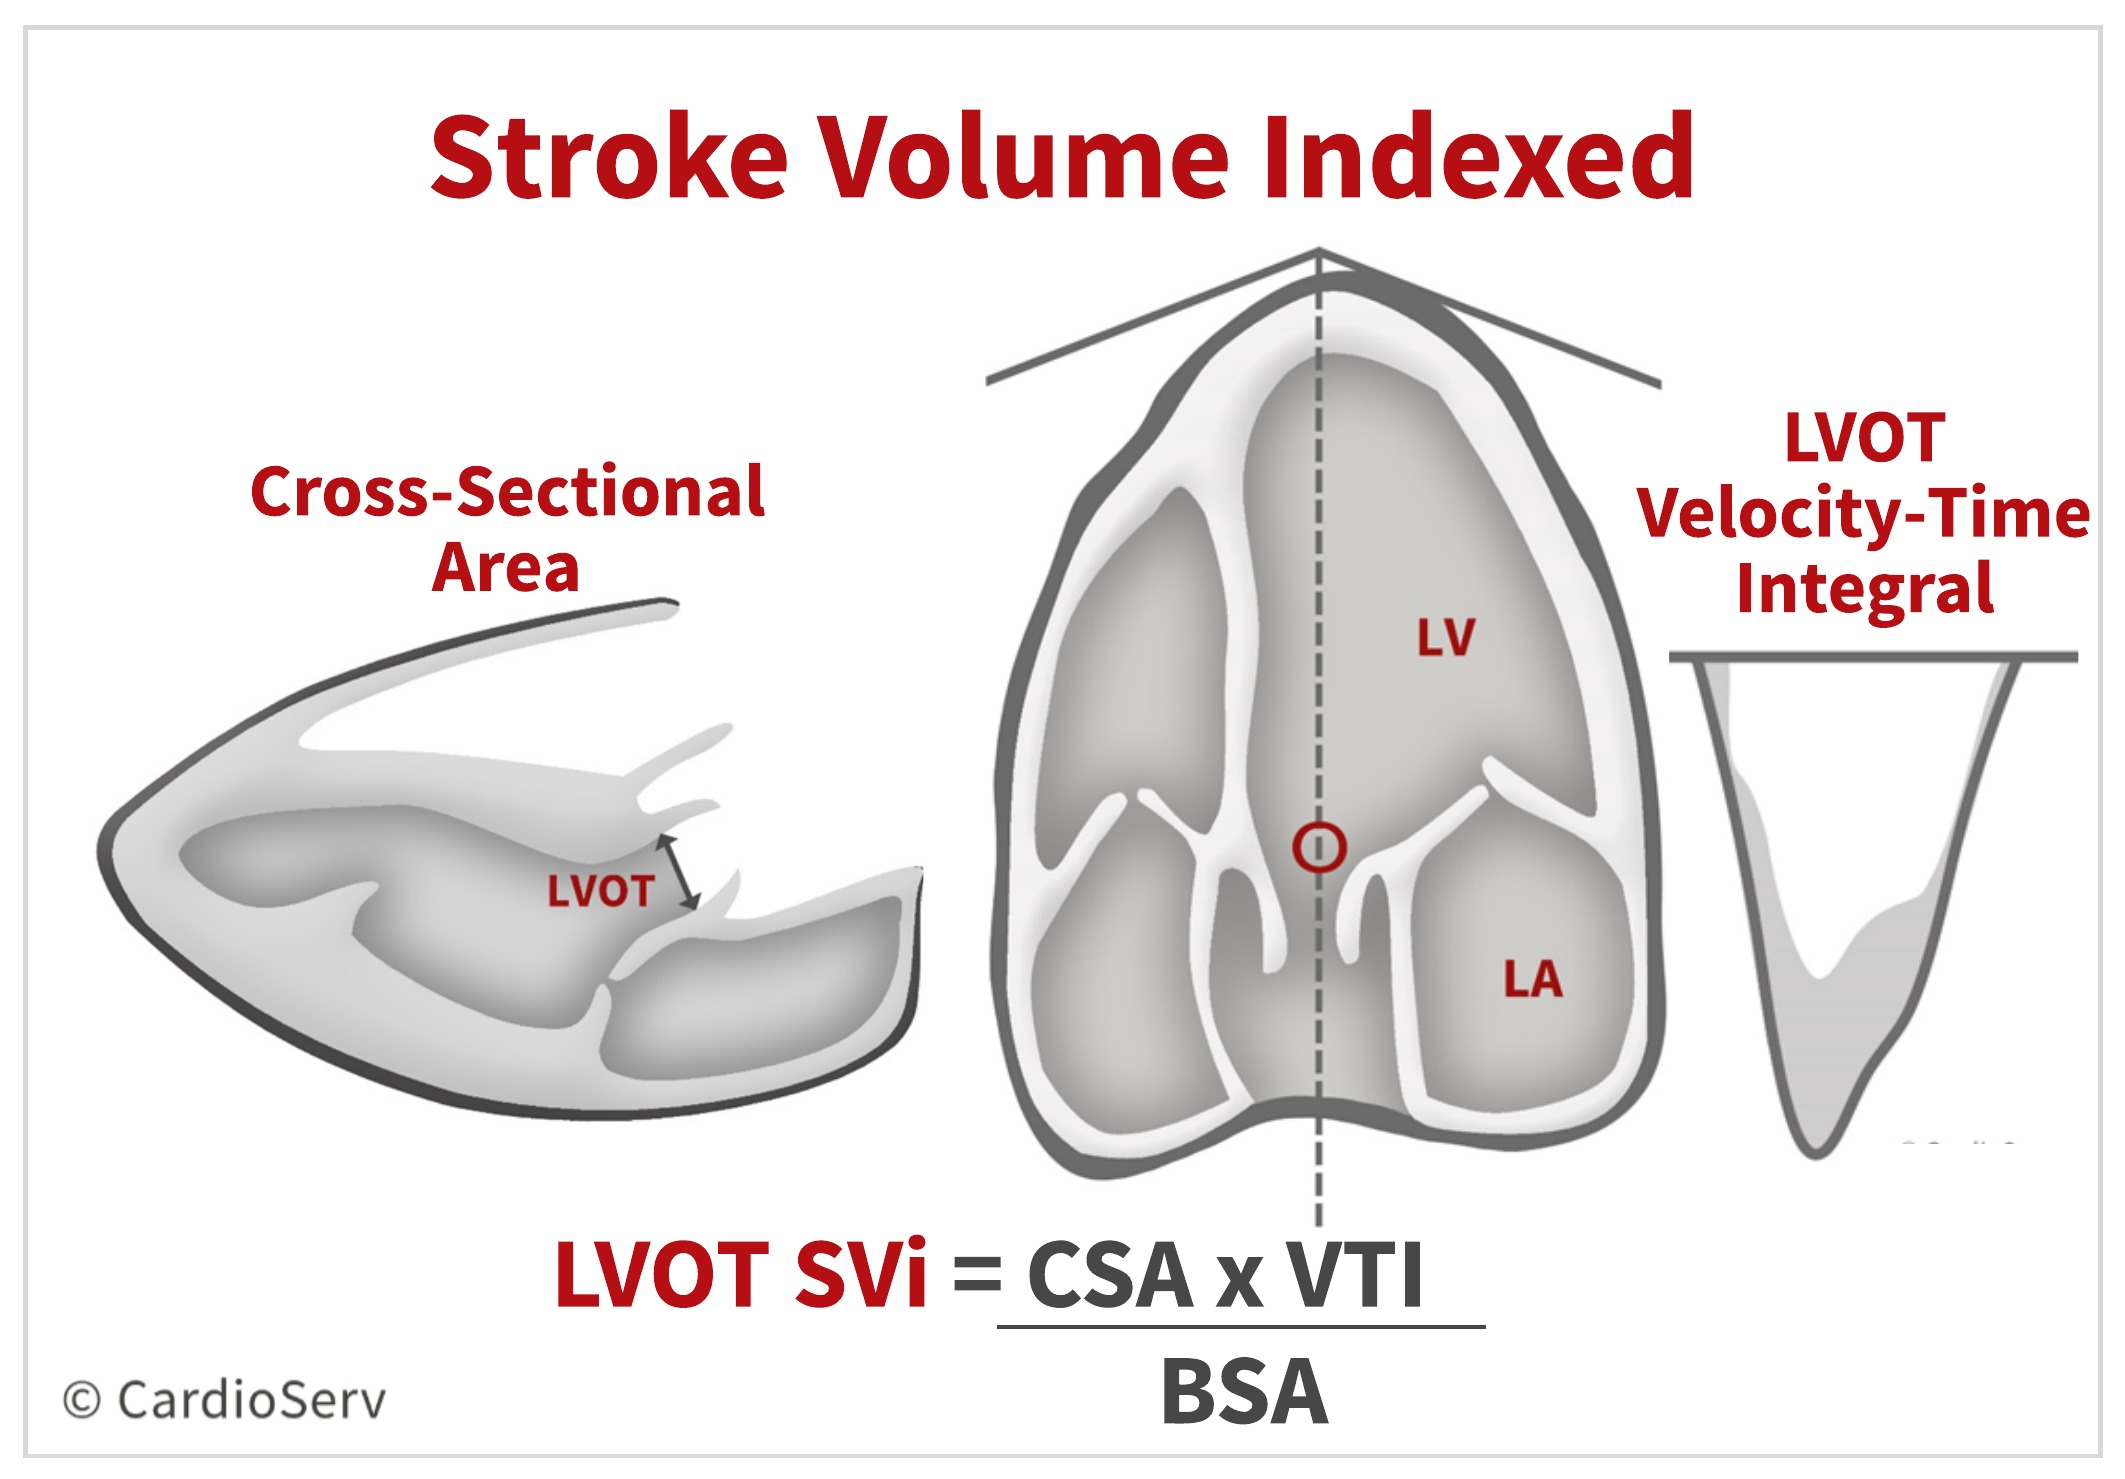
Both velocity and pressure gradients are flow dependent! Flow dependency is reflective upon the stroke volume (SV).
- Increased flow rate = increased velocity/gradient
- Decreased flow rate = decreased velocity/gradient
We can measure the degree of flow rate by calculating the stroke volume indexed to BSA (SVi).
When the patient does not have a normal SVi, the velocity and PG will be directly affected. The flow rate can be altered by various hemodynamic and physiological factors:
- Increased flow rate can be caused by anemia, hyperthyroidism, arteriovenous shunts, aortic regurgitation, dialysis shunts
- Decreased flow rate can be caused by decrease in LV systolic function
To compensate for an abnormal flow rate, the continuity equation calculated AVA is used.
TOP FACTORS TO CONSIDER:
- Hypertension can affect the velocity & mean PG.
- Valve appear more/less stenotic depending on systemic vascular resistance, transvalvular flow or flow-mediated forces
- Assessment should be made when hemodynamics are in normal range (BP/HR)
- Documentation of BP at time of study should be included on finalized report
- Velocity and PG are very specific. The continuity equation calculated AVA is more sensitive, less specific.
- Continuity equation involves multiple parameters in the equation …. which makes it more sensitive.
- Velocity and pressure gradients are flow dependent. Flow dependency (rate) is reflective upon the stroke volume (SV).
- The velocity and PG are very specific- if the flow rates are not normal, it will directly affect the velocity & mean PG.
- The calculation of the AVA is important when flow rates are abnormally high or low to compensate for abnormal stroke volumes.
- The cut-off values are not consistent between all 3 parameters.
- Do not determine the severity of AS based on only the calculated AVA!
- Evaluate all 3 factors (Peak AS Jet Velocity, Mean PG, AVA) to determine the severity.
- If discordant values occur, further investigation should be performed to determine potential error or presence of sub-category AS.
- LV ejection fraction (EF) is load dependent.
- Decrease in LV EF can cause a decrease in velocity & mean PG in a truly stenotic valve.
SUMMARY
The entire process of evaluating our patients for aortic stenosis using echo is very detailed and tedious process. As clinicians, it is crucial to not only understand how to evaluate for aortic stenosis, but to understand the hemodynamic factors that can alter our evaluation parameters. The measured values we obtain to determine the severity of stenosis determines the patients clinical outcome.
Check out past blogs on Aortic Stenosis!
- Aortic Stenosis: Breaking Down the Continuity Equation
- 4 Errors to Avoid when Measuring Aortic Valve Velocity
- Helpful Tips to Mastering the Pedoff Probe!
- Back to Basics: Aortic Valve Anatomy
- How to Master Aortic Measurements with These 5 Techniques
WANT TO EARN CAT. 1 AMA ECHO CMES?! ACCESS THEM HERE!

Andrea Fields MHA, RDCS
Stay Connected: LinkedIn, Facebook, Twitter, Instagram
References:
Baumgartner, H., Hung, J., Bermejo, J., Chambers, J. B., Edvardsen, T., Goldstein, S., . . . Otto, C. M. (2016). Recommendations on the echocardiographic assessment of aortic valve stenosis: A focused update from the European Association of Cardiovascular Imaging and the American Society of Echocardiography. European Heart Journal – Cardiovascular Imaging, 18(3), 254-275. doi:10.1093/ehjci/jew335
Nakatsuma, K., Taniguchi, T., Morimoto, T., Shiomi, H., Ando, K., Kanamori, N., . . . Kimura, T. (2017). Prognostic Impact of Peak Aortic Jet Velocity in Conservatively Managed Patients With Severe Aortic Stenosis: An Observation From the CURRENT AS Registry. Journal of the American Heart Association,6(7). doi:10.1161/jaha.117.005524