Last Updated on January 30, 2024 by Hannes van der Merwe
CORRECT ECHO TECHNIQUES IN PULMONARY HYPERTENSION: CASE STUDY PRESENTATION
An 85 year old patient presents to the ER with worsening shortness of breath and a history of known pulmonary hypertension. Her chest x-ray reveals massive cardiomegaly. An echo is ordered to assess the status of her pulmonary hypertension. We will present this echo to illustrate the correct techniques when performing an echocardiogram with the indication of pulmonary hypertension. Learn about the LV Eccentricity index and the latest recommendations for calculating correct RA pressure through evaluation of the IVC.
RIGHT VENTRICLE PATHOPHYSIOLOGY
During pulmonary hypertension, there is chronic progressive pressure loading of the right ventricle causing hypertrophy and eventual dilation. The enlargement then causes contractile impairment, low cardiac output and eventual right heart failure.
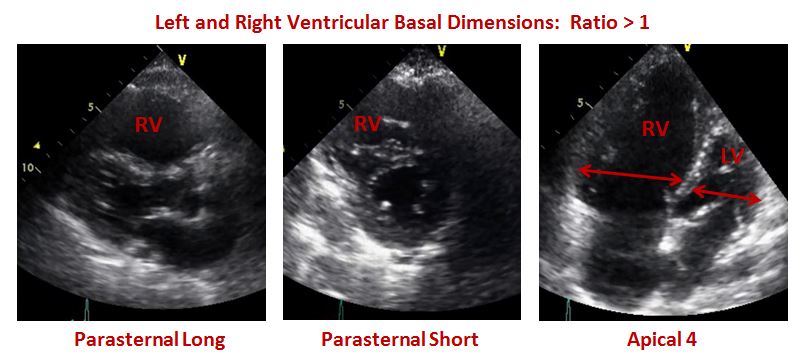
RIGHT VENTRICULAR ENLARGEMENT
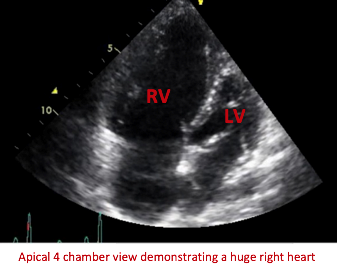
This echo demonstrated a dilated RV. Below is the echo in the parasternal long axis, short axis and apical four chamber views. This echo demonstrated the findings of a ratio greater than one when comparing the right and left basal dimensions.
RIGHT VENTRICLE HYPERTROPHY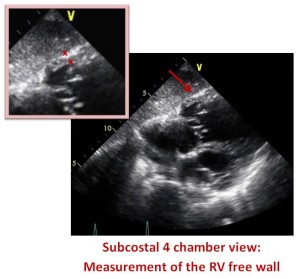
Right ventricular hypertrophy is defined by a free wall thickness of greater than 5 mm. The new 2015 ASE guidelines recommend measuring the RV wall thickness in the subcostal window below the tricuspid annulus on a zoomed image with the focus on the RV mid-wall. The subcostal view can also be useful in estimating the degree of RV dysfunction and RV wall thickness in patients whose other views are difficult to image. This patient presented with a RV free wall dimension of 5.7mm.
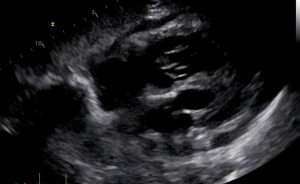
 Moderator Band
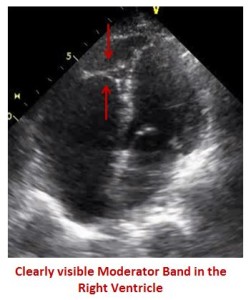
The moderator band is one of the first structures to become hypertrophied. In normal patients, the moderator band is thin and difficult to see on an echo. However, this patient presented with a moderator band that was clearly visible, as is often the case in pulmonary hypertension.
FLATTENING OF IVS
In a normal heart, the left ventricle maintains a circular shape. In pulmonary hypertension, the increased RV pressure moves the interventricular septum to the left. This makes the left ventricle appear with the characteristic D-Shape. This case study had the classic presentation of septal D flattening.
Volume Overload vs. Pressure Overload
Remember that a right ventricle that is overloaded purely by a volume overload will only deviate the septum in diastole. This is because a volume overload will raise the end diastolic pressure. On the other hand, when the right ventricle is overloaded with a pressure overload the septum will deviate in systole. With severe pressure overload the septum will deviate into the LV cavity.
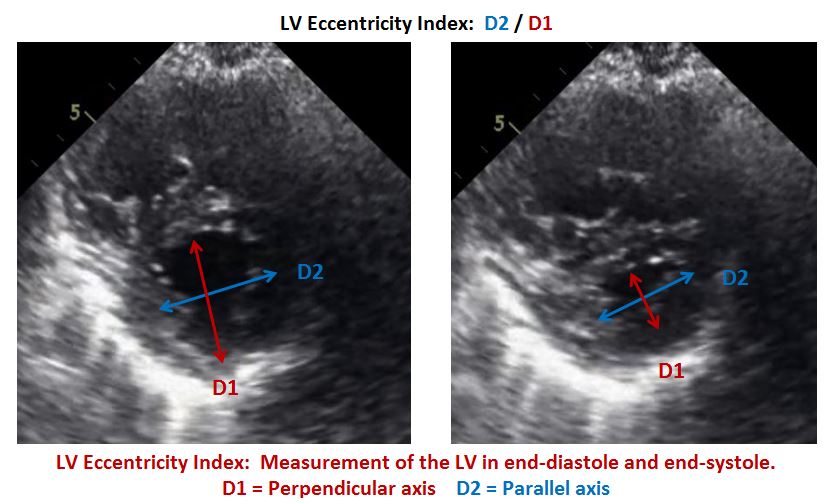
Left Ventricular Eccentricity Index
This case study was also an excellent example of an increased LV Eccentricity Index. What is the LV Eccentricity Index and how is it measured? The LV Eccentricity Index is the ratio of the parallel axis of the LV cavity (D2) divided by the perpendicular axis of the LV cavity (D1). As you can see in the case study images below, the pressure overload creates systolic flattening of the septum which results in an increased eccentricity index. The LV eccentricity index in pulmonary hypertension is greater than 1.1.
HEMODYNAMICS
Severe Tricuspid Regurgitation
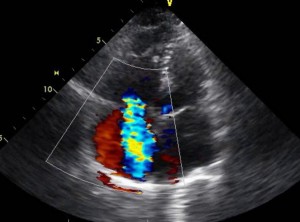
The dilation of the right ventricle results in tricuspid annular dilation. This is the cause of the severe tricuspid regurgitation associated with pulmonary hypertension. The severity of the tricuspid regurgitation relates to survival. Tricuspid regurgitation can be evaluated by the structure of the valve, jet area and density or measurement by continuous-wave Doppler. This patient presented with moderate to severe tricuspid regurgitation.
Systolic Pulmonary Pressure
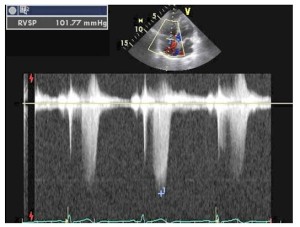
One of the many useful findings with echocardiography in the RVSP 101 evaluation of pulmonary hypertension is the ability to calculate the pulmonary systolic pressure. In the absence of pulmonary stenosis, the pulmonary systolic pressure is assumed equal to the right ventricular systolic pressure (RVSP). This patient presented with severe pulmonary hypertension with a calculated RVSP of 102mmHg
We are all familiar with calculating the RVSP through the measurement of the tricuspid regurgitant jet velocity.
Systolic Pulmonary Pressure = RVSP
RVSP = 4V2 + RAP
(V = TR max velocity)
The challenge becomes knowing what number to enter for the estimated RA pressure (RAP). All too often the standard number of 10 is entered into the RVSP calculations which can over or under estimate the correct RVSP. The latest update in the ASE 2015 Guidelines now simplifies the process of determining the RAP by replacing ranges with specific values.
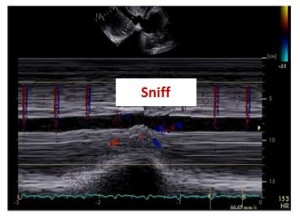
Collapsibility Index
The Collapsibility Index refers to the relationship of the IVC diameter and the IVC percent of collapse during a sniff (sudden inspiratory maneuver). These two items (IVC diameter and % collapse) correlate with the RAP, referred to as the collapsibility index.
The easiest way to remember the specific RAP values is to understand the opposite ends of the RAP spectrum – the normal versus high pressure. Everything else will just fall into the middle category.
Normal RAP = 3mmHG
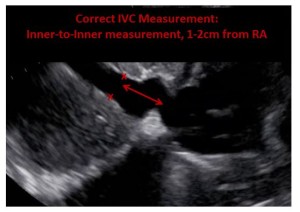
Normal right atrial pressure is assigned when the IVC is normal in size and collapsibility.
- IVC < 2.1cm
- IVC collapses more than 50% with sniff
High RAP = 15mmHg
High right atrial pressure is assigned when the IVC is dilated and does not collapse normally.
- IVC > 2.1cm
- IVC collapses less than 50% with sniff
Intermediate RAP = 8mmHg
A middle value of 8mmHg is assigned in any scenario that doesn’t meet the normal and high values. For example in a patient that has a dilated IVC but demonstrates normal collapsibility or vice versa, normal IVC size but abnormal collapsibility.
| RAP | mmHg | IVC Size | IVC Collapse |
| Normal | 3 | Normal | Normal |
| High | 15 | Abnormal | Abnormal |
| Intermediate | 8 | Normal Abnormal | Abnormal Normal |
In this case study, the patient presented with a dilated IVC measuring 2.3cm and an IVC collapse of less than 50%. Based on this collapsibility index, the estimated RAP is 15 mmHg. Remember, the best way to observe the IVC collapse is by using M-Mode as it allows you to observe the IVC before, during and after the sniff maneuver.
 |  |
RIGHT VENTRICULAR FUNCTION
The new ASE Standards and Guidelines for Chamber Quantification have released new recommendations for the quantification of the right ventricular function. Within the Echo community we often find ourselves making a general statement regarding the size and function of the RV instead of actual quantitative data measuring the size and function of the RV. In a future blog I will discuss the correct techniques for measuring the RV size and function. In this case study, the right ventricular function was severely reduced.
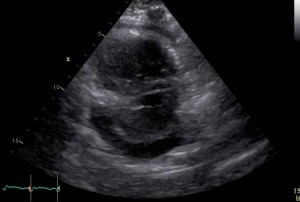
PERICARDIAL EFFUSION
The elevated right atrial pressure in pulmonary hypertension can result in pericardial effusion. One hypothesis of why this occurs is that the high right atrial pressure compromises the pericardial fluid draining. Evidence also shows that patients with right ventricular failure and pericardial effusion develop an atypical cardiac tamponade where there is no right atrial and ventricular diastolic collapse, pulses paradoxes or hypotension. The presence of pericardial effusion in pulmonary hypertension is associated with an increased mortality. In this case study, the patient was followed over a period of many months. During one of her echocardiograms, she presented with moderate circumferential pericardial effusion with no signs of tamponade.
 |  |
CONCLUSION
This case study presentation demonstrates how echocardiography has a role in assessing patients for pulmonary hypertension and assessing the disease progression and hemodynamic consequences. A right heart catheterization is the gold standard for measuring the PA pressure and diagnosing Pulmonary Hypertension.
This patient had multiple echocardiograms over the course of a year and received a right heart catheterization at a time when her echocardiogram had calculated her RVSP as 82mmHg. Her right heart catheterization calculated her right heart pressure at that time as 87mmHg showing a close correlation.
We will discuss the differential presentation to the right heart in pulmonary embolism versus pulmonary hypertension and the correct measurement techniques to quantify right heart function in future blogs. Sign up to receive our blogs directly into your email inbox.
SOURCES
- Echocardiographic assessment of pulmonary hypertension: standard operating procedure
Luke S. Howard, Julia Grapsa, David Dawson, Michael Bellamy, John B. Chambers, Navroz D. Masani,Petros Nihoyannopoulos, J. Simon R. Gibbs
European Respiratory Review Sep 2012, 21 (125) 239-248; DOI: 10.1183/09059180.00003912 - Recommendations for Cardiac Chamber Quantification by Echocardiography in Adults: An Update from the American Society of Echocardiography and the European Association of Cardiovascular Imaging
Lang, Roberto M. et al.
Journal of the American Society of Echocardiography , Volume 28 , Issue 1 , 1 – 39.e14 - 2015 ESC/ERS Guidelines for the diagnosis and treatment of pulmonary hypertension
European Heart Journal Aug 2015, DOI: 10.1093/eurheartj/ehv317