Last Updated on January 30, 2024 by Hannes van der Merwe
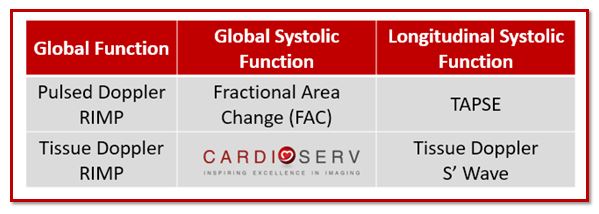
In the past few weeks, we have reviewed different quantitative methods for evaluating the right ventricular function with echocardiography to include:
This week we will review how to use the RIMP method to assess RV function. You will learn 4 concepts regarding RIMP:
- What is RIMP?
- How do I obtain RIMP?
- Reference Range
- Advantages and Limitations
1. WHAT IS RIMP?
RIMP stands for Right Ventricular Index of Myocardial Performance and is an index of global RV performance. The value represents the relationship between the ejection and non-ejection time of the heart. The “non-ejection” times are the periods of time when all heart valves are closed.
Non-ejection time: (very small increments of time):
- Just after the tricuspid/mitral valve closes and before the pulmonic/aortic valves open
- Likewise, just after the pulmonic/aortic valve closes and before the tricuspid/mitral valves open again
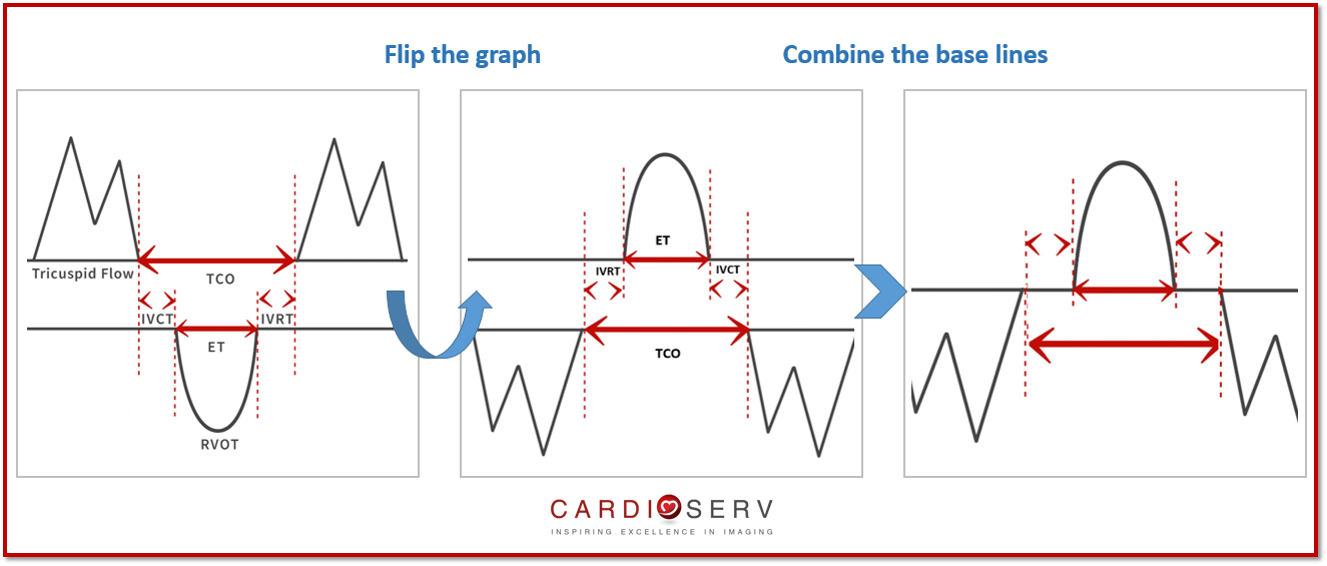
To better visualize these time intervals look at the diagram below. The diagram makes it easier to appreciate that the total time the tricuspid valve is closed (TCO) is longer than the pulmonic ejection time (ET). This brings our attention to the little intervals of time before and after the RVOT ejection time when the tricuspid valve is still closed. (IVCT and IVRT)
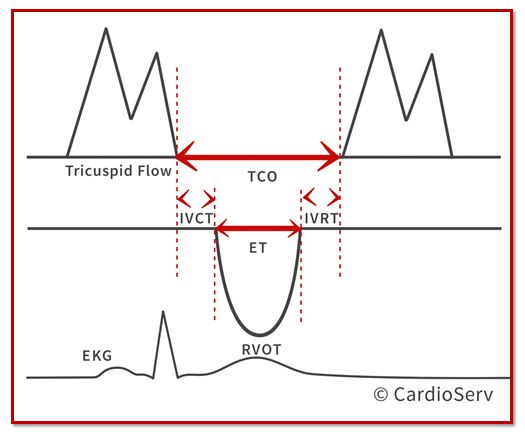
TCO – Tricuspid Closure-Open Time. This is the time between the tricuspid valve opening and closing
ET – Ejection Time. This is the time during the ejection of blood through the pulmonic valve
IVCT – Isovolumic contraction time. This is the time after TV closure and before PV opening
IVRT – Isovolumic relaxation time. This is the time after PV closure and TV opening
How do these time intervals relate to RIMP?
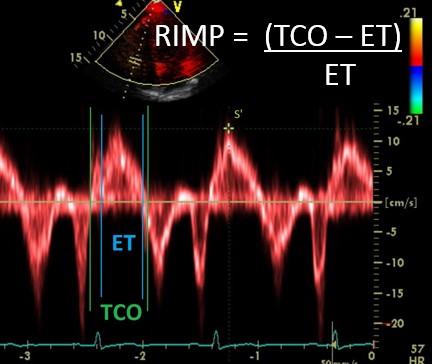
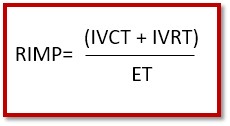
RIMP is the non-ejection time (IVRT + IVCT) divided by the ejection time. To see this in a formula that would be:
RIMP = (non-ejection time) / ejection time
RIMP = (IVCT + IVRT) / ET
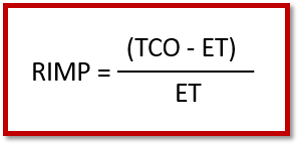
Remember, we are just trying to find a way to express non-ejection time / ejection time. Another way of expressing non-ejection time that does not require measuring the tiny time intervals of the IVCT and IVRT would be to take the total time the tricuspid valve is closed (TCO) and subtracting the RVOT ejection time (ET). (Look back at the diagram and see the relationship between TCO and ET)
RIMP = (non-ejection time) / ejection time
RIMP = (TCO – ET) / ET
2. HOW DO WE OBTAIN RIMP?
There are 2 methods to performing RIMP. One requires a two-step process that involves taking measurements from 2 different images and paying careful attention to R-R intervals. Yes….. I lost you already! We are not going to teach that method as we understand the reality of real-life scanning! This week we will teach the tissue Doppler method with all the measurements performed on a single beat. Good news….if you are already performing the S’Wave you already freeze the perfect tissue Doppler image to perform RIMP!!
Steps to performing RIMP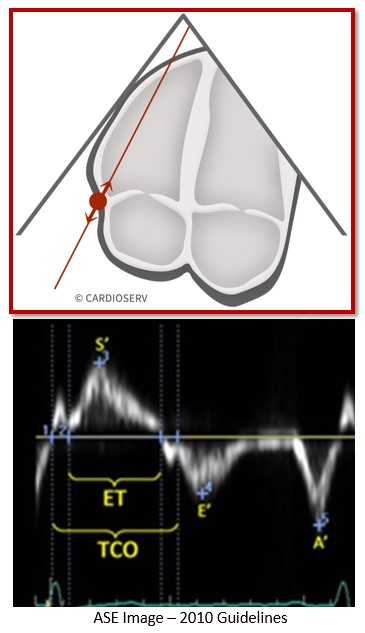
- The ASE suggest using the standard AP4 window when performing RIMP measurement.
- Use the same technique used for S’ wave and place the cursor over the lateral annulus of the tricuspid valve
- Pulse wave Doppler the TDI
- Decrease gains to avoid noise and limit artifacts
- Ensure the motion of the annulus is towards the apex
- Freeze image with a clear S’, E’ and A’ waveform
- Measure all the time intervals from same 1 single beat
- TCO (Tricuspid Valve Closure to Open time)
- Time the Tricuspid Valve is closed
- From end of TV A-wave to beginning of the following TV E-wave
- Do not get confused and measure the duration of the E-A wave – you are measuring the time INBETWEEN the E-A waves!
- ET (Ejection time of RVOT)
- Represented by the duration of the S’ Wave
- Do not include the IVCT and IVRT times
- From end of IVCT to beginning of IVRT
- TCO (Tricuspid Valve Closure to Open time)
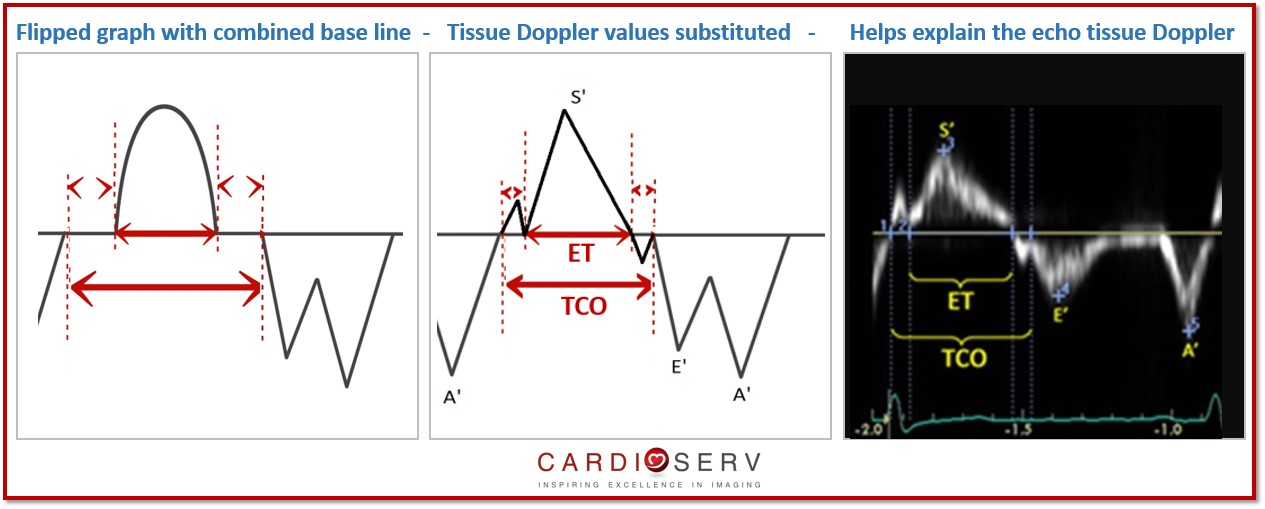
If you are having a hard time imagining how the tissue Doppler measurements relates to the original diagram, just flip the diagram upside down and place it next to your tissue Doppler image to better understand each time interval. Look…..
3. REFERENCE RANGES
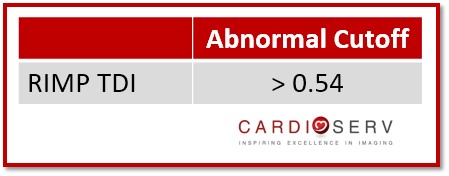
If your machine is not set up with this measurement package, then the values will need to be calculated into the equation manually:
4. LIMITATIONS AND ADVANTAGES
Limitations
The most obvious limitation of RIMP is obtaining a clear enough tissue Doppler reading to properly identify the non-ejection periods of the heart. As I was looking through everyday examples of right heart tissue Doppler it was hard to find images with clear enough wave forms to correctly identify the periods of IVRT/IVCT and therefore TCO. Other limitations include:
- RIMP varies with pressure and volume status
- Unreliable when RA pressure is elevated
- Shortens the IVRT
Advantages
- Reproducible
- Avoids geometric assumptions of complex RV geometry
- Allows for measurement of RIMP and S’ Wave from a single image
TIPS
RIMP is another option to use for quantifying the RV function and can be obtained from the same frame as the S’ Wave measurement.
- While obtaining the S’ Wave start looking to see if the TCO and ET times are noticeable
- If the Doppler is not clear – pay special attention to the cursor placement through the annulus
- Ensuring the motion of the TV annulus moves towards the apex helps!
- Adjust gains to clean up Doppler image
CONCLUSION
We have now covered four different methods that ASE provides for quantifying RV function. Remember, ASE recommends that we perform at least ONE or combination of the following: TAPSE, S’ Wave, FAC or RIMP. The goal of this blog series is to break down the quantification methods so they are easy to understand and easy to implement. Let’s add quantification methods regarding RV systolic function into our laboratories using the updated methods released by the ASE. Let us know how you are doing in regards to implementing RV quantification into your labs! Feel free to ask us questions or share your experiences.
WANT A CME FOR READING THIS BLOG? CLICK BELOW TO ACCESS CARDIOSERV’S ONLINE CME PLATFORM OFFERING CAT. 1 AMA CMES!


Judith Buckland, MBA, RDCS, FASE President
Stay Connected: LinkedIn, FaceBook, Twitter
References
Lang, R. M., MD, Badano, L. P., MD, & Mor-Avi, V., PhD. (2015). Recommendations for Cardiac Chamber Quantification by Echocardiography in Adults: An Update from the American Society of Echocardiography and the European Association of Cardiovascular Imaging. JASE, 28(1), 1-53. Retrieved March 1, 2017, from http://asecho.org/wordpress/wp-content/uploads/2015/01/ChamberQuantification2015.pdf
Rudski LG, Lai WW, Afilalo J, Hua L, Handschumacher MD, Chandrasekaran K, et al. Guidelines for the echocardiographic assessment of the right heart in adults: a report from the American Society of Echocardiography endorsed by the European Association of Echocardiography, a registered branch of the European Society of Cardiology, and the Canadian Society of Echocardiography. J Am Soc Echocardiogr 2010;23:685-713