Last Updated on November 18, 2025 by Don Gerig, RDCS
In echocardiography, Fractional Area Change (FAC) is one of the most reliable 2D measures of right ventricular (RV) systolic function.
While TAPSE and S′ velocity reflect only longitudinal motion, FAC integrates both longitudinal and radial contraction. This provides a more complete picture of global RV function.
According to the 2025 ASE Right Heart Guidelines, FAC is an important quantitative parameter for RV systolic function assessment. It should be included as part of a systematic, comprehensive right-heart evaluation.
In this article, we’ll review what’s new in the 2025 guidelines, how to measure FAC accurately, and why it remains one of the most powerful indicators of RV performance.
A Brief History of FAC in the Guidelines
- 2010 ASE Right Heart Guidelines: FAC was first introduced as one of the three main 2D measures of RV systolic function, along with TAPSE and S′. A cutoff of ≤35% was considered abnormal. It proved valuable but was limited by image quality and the risk of apical foreshortening.
- 2015 ASE Chamber Quantification Guidelines: FAC was reaffirmed as a reliable parameter of RV systolic function, maintaining the ≤ 35 % abnormal threshold. It was presented as one of several options for evaluating RV systolic function, with little additional detail on measurement technique.
- 2025 ASE Right Heart Guidelines: FAC is now emphasized as a core measurement of RV systolic function. While the cutoff remains the same, the guidelines provide more detail on acquisition (RV-focused view, inclusion of trabeculations and moderator band). They also recommend the use of ultrasound enhancing agents when needed. FAC is highlighted as capturing both longitudinal and radial contraction, making it more comprehensive than TAPSE and valuable in prognosis, especially in pulmonary hypertension.
What Is Fractional Area Change (FAC)?
Fractional area change (FAC) is an echo measurement that reflects global right ventricular systolic function. Even though FAC is reported as a percentage, you should not confuse it with ejection fraction (EF). The two describe different mechanics of contraction.
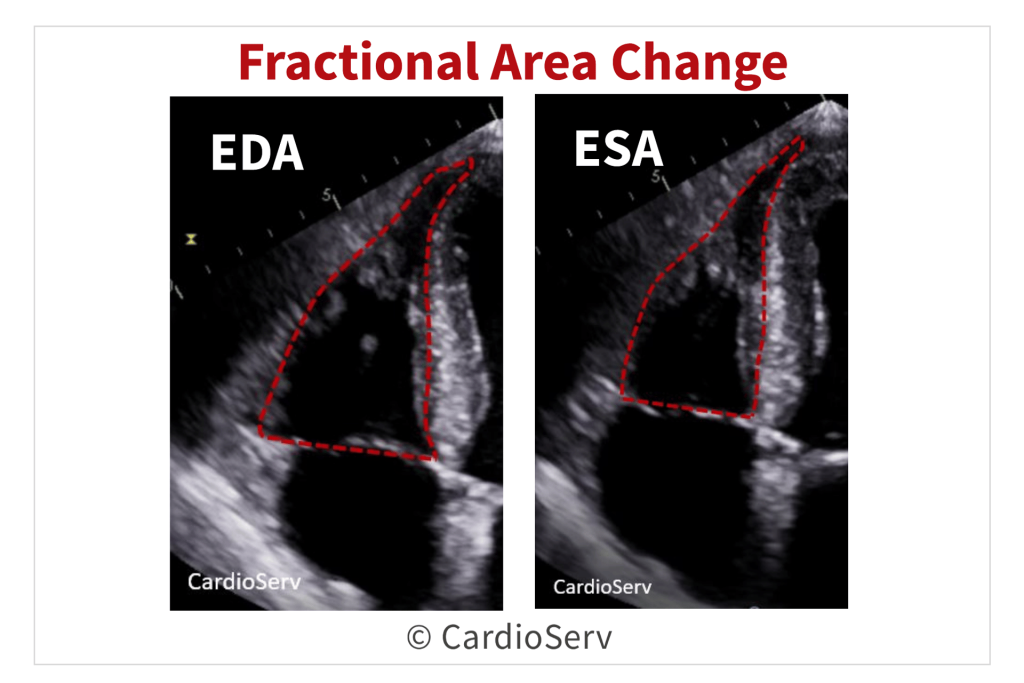
FAC in echocardiography quantifies the percentage change in RV area between end-diastole and end-systole, using the apical four-chamber RV-focused view. Unlike EF, which is derives from changes in ventricular volume, FAC is based purely on 2D area change.
Because FAC captures both longitudinal and radial contraction, it provides a global measure of RV systolic performance. It complements parameters like TAPSE and S′, which assess only longitudinal motion.
Quick Facts about FAC
- A normal value for FAC is 35% or higher.
- Based upon % of area change
- Reflects both longitudinal and radial components of RV contraction
- Correlates with RV EF by CMR
- Established prognostic value
FAC Severity Grading: What’s New
In the 2025 ASE Right Heart Guidelines, Fractional Area Change (FAC) moves beyond a single cutoff value to a graded severity system. This provides a more nuanced assessment of right ventricular systolic function.
Previously, any FAC < 35 % was considered abnormal. Now, FAC is categorized into four severity ranges:
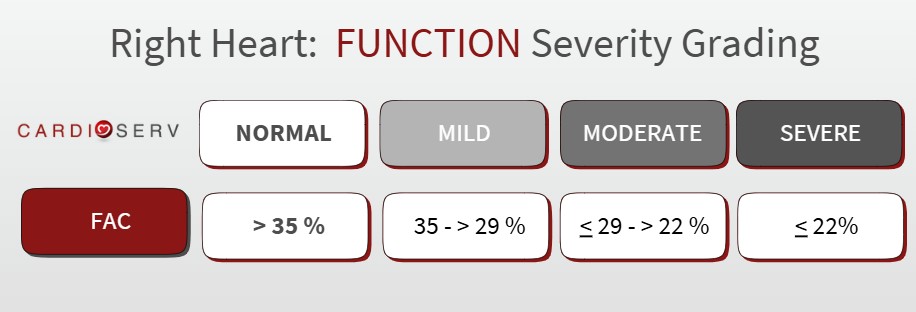
This new approach improves consistency between labs and aligns FAC grading with other RV systolic parameters, including TAPSE, S′, and RV strain. It provides clinicians with a clearer framework for describing right-heart function and prognosis.
How To Measure Fractional Area Change
Obtain FAC from the RV-focused apical 4-chamber view by tracing the endocardial border of the right ventricle in both end-diastole and end-systole.
To ensure accuracy and reproducibility:
- Trace the RV endocardial border at end-diastole and end-systole, including trabeculations and the moderator band.
- Include the apex and entire free wall, avoiding foreshortening.
- Normal FAC: >35%.
- Abnormal FAC graded into mild, moderate and severe
- Use ultrasound enhancing agents (UEA) if endocardial definition is suboptimal.
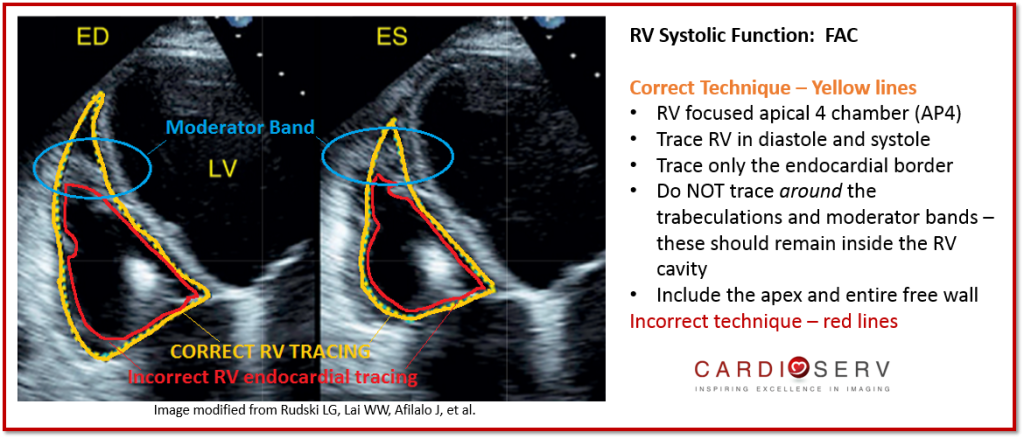
When performed correctly, the yellow trace (above) demonstrates the proper inclusion of trabeculations and the moderator band. This results in a true global measure of RV systolic function.
To go into more detail on what FAC is and and additional tips in measuring FAC, check out our article: 5 Things to Know about Measuring Fractional Area Change (FAC)
Why FAC Matters
Fractional Area Change (FAC) stands out as one of the most powerful and practical measures of RV systolic function. FAC combines accuracy with clinical relevance. It offers more than just a number (normal vs abnormal), it offers insight into prognosis, confidence in reporting, and alignment with cardiac MRI data.
Here’s why FAC deserves a place in every right-heart assessment:
- Correlates strongly with CMR-derived RVEF: FAC has one of the strongest correlations with cardiac MRI (CMR), the gold standard for RV function.
- Captures more than just longitudinal motion: Unlike TAPSE and S′, which reflect only longitudinal shortening at the base, FAC incorporates longitudinal shortening, radial wall thickening, and septal contribution, making it a more global marker of RV performance.
- Reliable when other parameters fall short: TAPSE and S′ can be misleading in certain scenarios such as post-surgical patients, pacing leads, or abnormal loading conditions. FAC adds value in these situations by providing a more complete picture of RV function.
- Carries prognostic weight: Reduced FAC is linked to worse outcomes in pulmonary hypertension and other RV diseases, reinforcing its role as not just a measurement but a marker with clinical implications.
Limitations and Pitfalls of FAC
While Fractional Area Change (FAC) is a valuable and guideline-recommended parameter for assessing right ventricular systolic function, it’s not without limitations. Understanding these pitfalls helps improve accuracy, reproducibility, and confidence in interpretation.
- Foreshortening of the RV-focused view: Even slight foreshortening can underestimate true RV area change. Always ensure the RV-focused apical view includes the apex and full free wall to avoid distortion.
- Endocardial definition: Poor image quality or excessive trabeculations can obscure the endocardial border, making accurate tracing difficult. Use careful gain adjustments and optimize depth before measurement.
- Inter- and intra-observer variability: Because FAC is a manually traced parameter, differences in technique can introduce variability, especially if unable to clearly define endocardial borders. Consistent training and use of standardized measurement protocols can help minimize this.
- Regional wall motion abnormalities: FAC reflects global RV function, so it may not detect localized dysfunction (e.g., RV infarction or segmental wall motion abnormalities). Complement with strain or 3D imaging when you suspect regional disease.
- Contrast dependence: Ultrasound enhancing agents (UEA) can be invaluable for technically difficult studies, improving border visualization. However, not all labs use UEA routinely, which may limit FAC accuracy in challenging patients.
Final Thoughts and Next Steps
The 2025 ASE Right Heart Guidelines reaffirm Fractional Area Change (FAC) as a core parameter for assessing RV systolic function. They also emphasize not to use any single measurement in isolation.
A complete evaluation of RV function requires integrating multiple indices such as FAC, TAPSE, S′, 3D RVEF, and RV strain. These should be interpreted alongside right-heart size, hemodynamics, and the clinical context. Together, these parameters provide the most accurate and reproducible picture of RV performance.
Our updated CME course — Right Heart Quantification: Fractional Area Change (FAC) — walks you step-by-step through how to measure and interpret FAC accurately. You’ll learn how to trace the RV correctly, recognize common pitfalls, and integrate FAC with complementary indices to improve accuracy in reporting.
Ready to Go Beyond FAC?
For a complete understanding of right-heart quantification, explore the All Right Heart Modules Bundle — covering every major RV parameter (FAC, TAPSE, S′, strain, and more).
Each module provides step-by-step instruction, image examples, and clinical integration guidance — offering 5.0 CME credits upon completion!