Last Updated on November 18, 2025 by Don Gerig, RDCS
Few measurements in echo are as quick and powerful as the S′ velocity. With a single tissue Doppler tracing of the tricuspid annulus, we can quickly gauge whether the right ventricle is pulling its weight.
Because of its speed, simplicity and reproducibility, S′ has become a go-to tool for assessing right ventricular (RV) systolic function, especially in pulmonary hypertension, heart failure, and congenital heart disease. Even in technically difficult studies, it provides an initial quantitative look at RV function that complements other parameters like TAPSE and Fractional Area Change (FAC).
In this article, we’ll review what’s new in the 2025 ASE guidelines, how to measure S′ accurately, and how to interpret it within the broader right-heart framework.
A Brief History of S’ Velocity in Echo
2010 ASE Right Heart Guidelines
- In 2010, ASE formally included S′ velocity as one of the three recommended quantitative measures of right ventricular RV systolic function, alongside TAPSE and FAC. Abnormal S’ velocity was defined as <9.5 cm/s. Due to its technical simplicity, angle independence in apical views, and, most importantly, its high reproducibility, S′ quickly gained adoption in echo labs for assessing RV performance.
2015 ASE Chamber Quantification Guidelines
- S′ remained a core parameter for RV systolic function, with the same cutoff (<9.5 cm/s). The guidelines emphasized that S′ primarily reflects longitudinal shortening of the RV free wall and should be interpreted alongside other indices to provide a more complete assessment of RV performance.
2025 ASE Right Heart & PH Guidelines
- The latest guidelines reaffirm S′ as a core measurement of RV systolic function while also highlighting its prognostic value, especially in pulmonary hypertension, heart failure, and congenital heart disease. Additionally, they emphasize the importance of angle alignment, consistent gain settings, and the use of color tissue Doppler or spectral TDI to optimize signal quality.
What Is S’ Velocity?
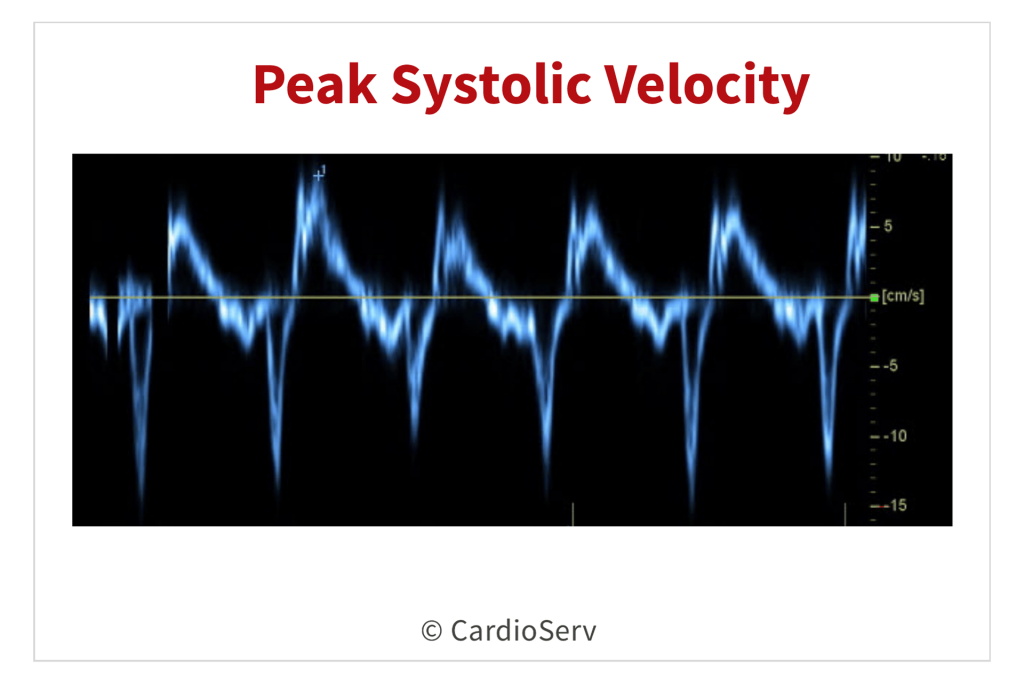
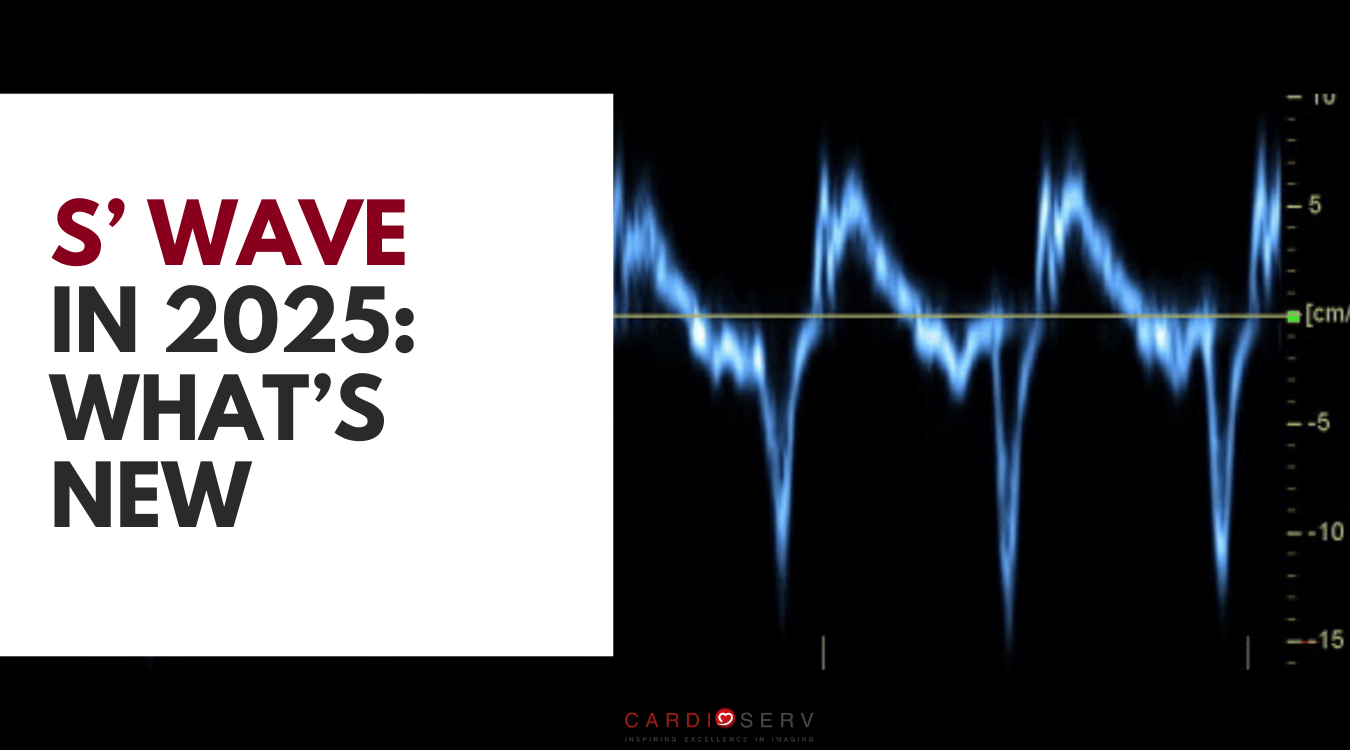
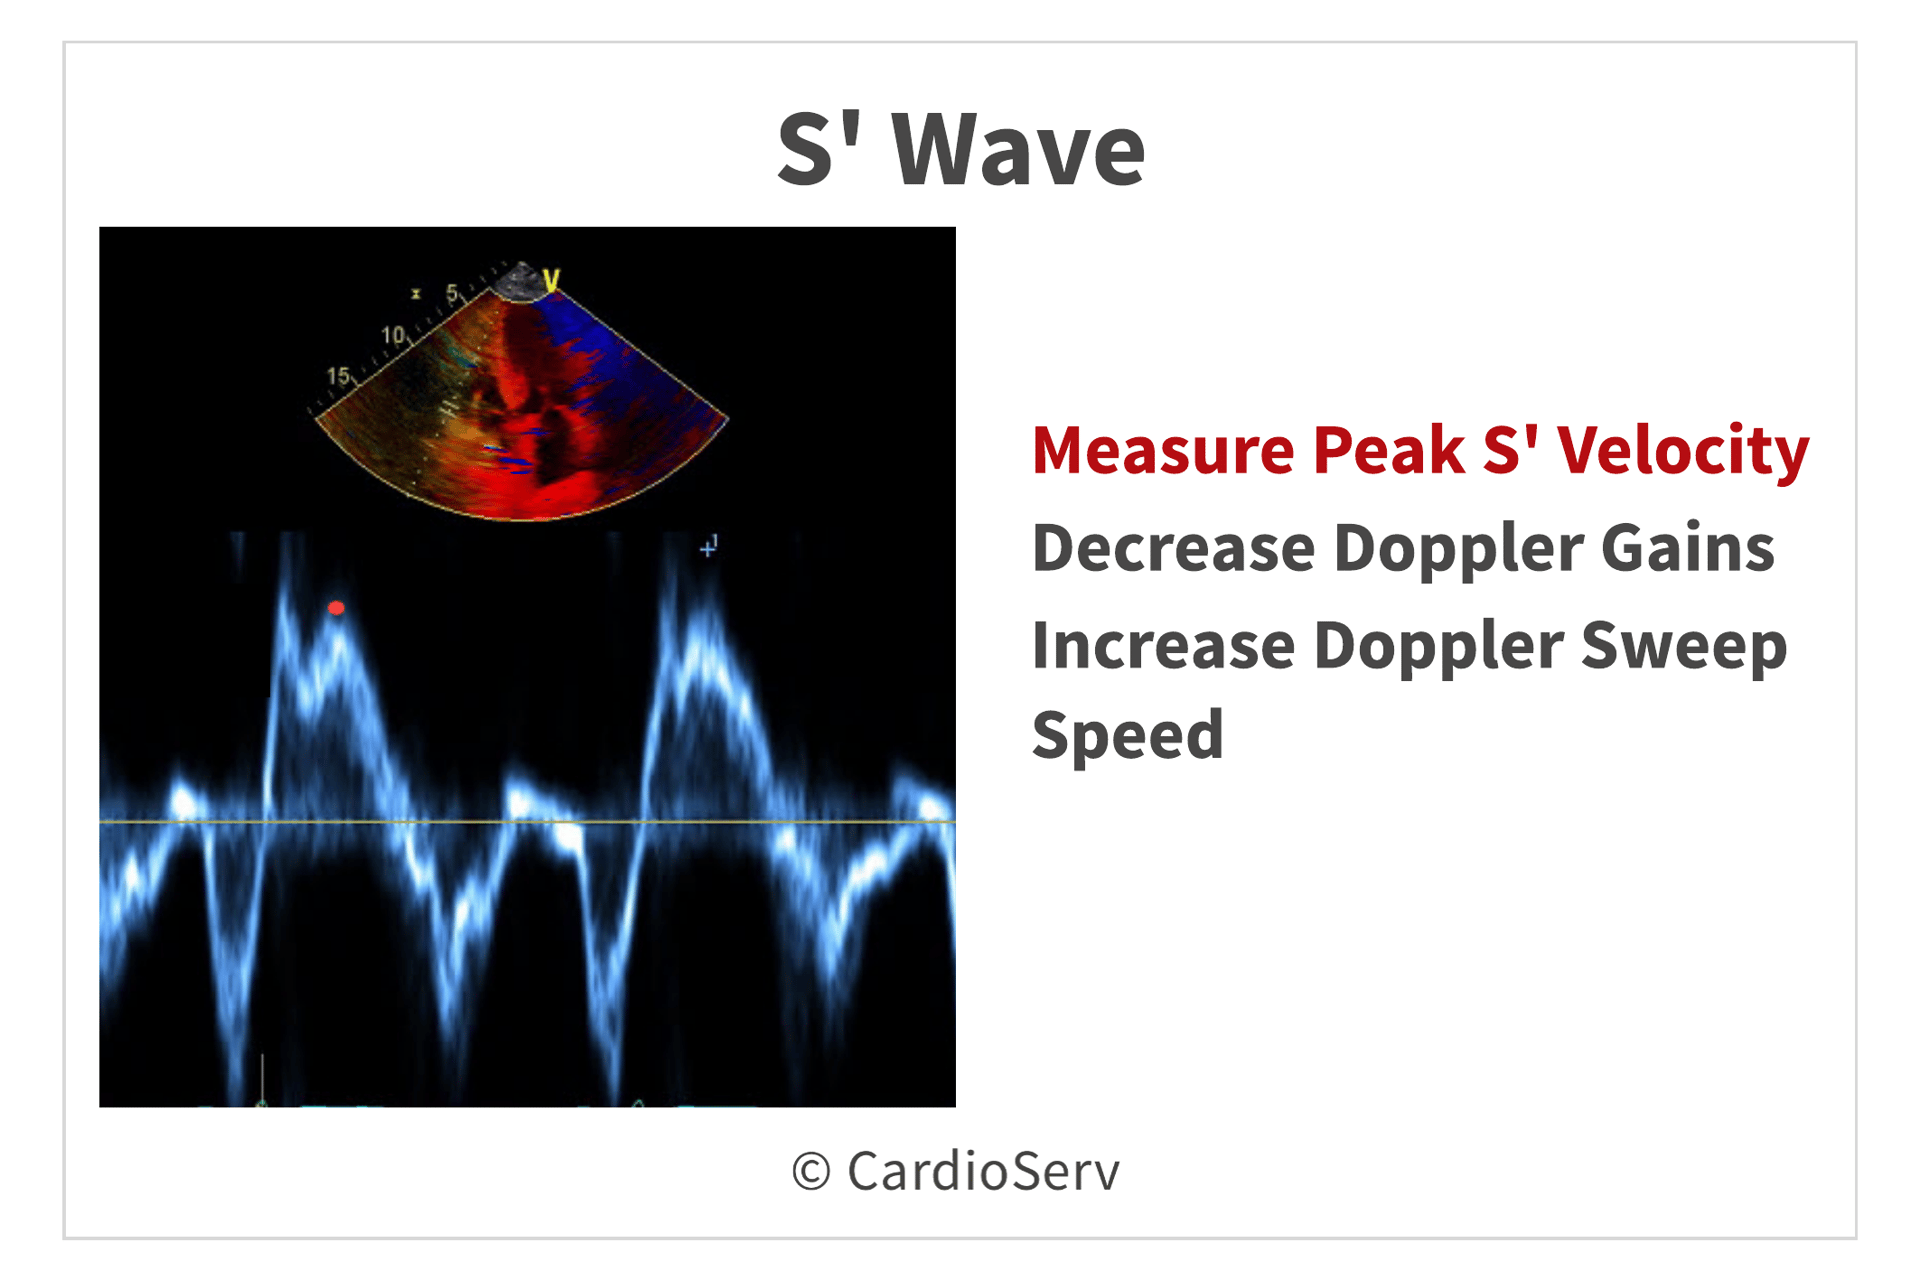
S′ wave (Tricuspid Annular Systolic Velocity) measures the speed of longitudinal movement of the lateral tricuspid annulus toward the apex during systole. It’s obtained using tissue Doppler imaging (TDI) in the RV focused apical four-chamber view, placing the sample volume at the lateral tricuspid annulus.
This velocity reflects longitudinal shortening of the RV free wall, the dominant component of right-ventricular contraction.
Because it is quick, simple, and highly reproducible, S′ has become one of the most widely used quantitative indices of RV systolic function in clinical echocardiography.
It’s important to remember that S′ represents only longitudinal motion, not global RV function. That’s why the 2025 ASE Right Heart Guidelines emphasize integrating S′ with other parameters (TAPSE, FAC, 3D RVEF, and RV strain) for a comprehensive assessment of right ventricular performance.
Quick Facts about S’ Velocity
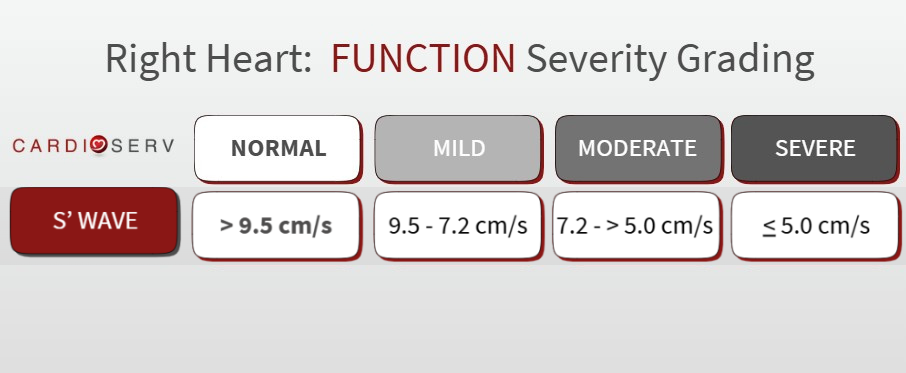
- Normal value: ≥ 9.5 cm/s ( < 9.5 cm/s = abnormal )
- Measurement site: Lateral tricuspid annulus via TDI
- Reflects: Longitudinal RV contraction ( not global function )
- Angle-dependent: Requires parallel cursor alignment with annular motion
S’ Velocity Grading: What’s New
For years, S′ velocity was reported as simply normal or abnormal, using a single cutoff of 9.5 cm/s. The 2025 ASE Right Heart Guidelines move beyond that simplicity by introducing graded severity ranges, allowing for a more nuanced evaluation of right ventricular (RV) systolic function.
This new approach improves consistency between labs and aligns S′ with how other RV systolic parameters—such as TAPSE, FAC, and RV strain—are now reported.
How to Measure S′
- Start with a RV focused apical 4-chamber view.
- Center the RV and ensure the lateral tricuspid annulus is clearly visualized.
- Place the tissue Doppler sample volume on the lateral tricuspid annulus.
- Keep the Doppler cursor parallel to annular motion. If you’re off-axis, you’ll underestimate S′.
- Record the peak systolic velocity (S′) during RV contraction.
Why S′ Grading Provides Stronger Prognostic Context
S′ velocity reflects longitudinal RV contractile function, which is one of the first components to deteriorate in pulmonary hypertension, RV volume overload, and RV failure.
Research and ASE guidance highlight that lower S′ values are associated with:
- Worse hemodynamic profiles (higher pulmonary artery pressures and elevated PVR)
- Reduced exercise capacity
- Higher mortality and hospitalization rates in patients with pulmonary hypertension and heart failure
By establishing graded severity ranges, clinicians can better differentiate mild versus moderate-to-severe dysfunction. This is information that can enhance risk stratification, prognostic discussions, and treatment decisions.
The graded approach moves S′ wave from being just a binary marker (“normal vs abnormal”) to a prognostic continuum. The degree of reduction provides clinical meaning and helps track disease progression or response to therapy.
Limitations and Pitfalls of S’ Velocity
While S′ is quick, reproducible, and easy to acquire, it’s not immune to technical and physiologic limitations. The 2025 ASE Right Heart Guidelines emphasize interpreting S′ within the full context of RV size, function, and loading conditions.
Common Pitfalls
Angle Dependency:
S′ accuracy relies heavily on proper Doppler alignment. Even small deviations from parallel alignment can significantly underestimate velocity.
Regional Dependence:
Because S′ reflects motion only at the lateral tricuspid annulus, it may not represent global RV function. This is especially true in cases of regional wall motion abnormalities, post-surgical changes, or pacemaker leads.
Load Sensitivity:
S′ values can vary with changes in preload and afterload, making interpretation difficult in patients with fluctuating hemodynamics or volume status.
Overestimation and Underestimation:
- Overestimation: May occur with severe tricuspid regurgitation or annular distortion.
- Underestimation: Seen in constrictive pericarditis, RV pacing, or post-cardiac surgery.
Final Thoughts and Next Steps
The 2025 ASE guidelines keep S′ wave velocity on the map as one of the quickest, easiest, and most reproducible tools for RV systolic function. The cutoff remains < 9.5 cm/s, but the key message is context. It works best as part of the multiparametric approach that now defines right heart assessment.
Go Deeper!
Want to master S’ wave velocity in practice along with TAPSE? Our updated CME course — Right Heart Quantification: TAPSE and S′ Wave — walks through everything you need to know. You’ll learn step-by-step how to perform TAPSE, avoid common measurement errors, and apply TAPSE and S′ as part of a comprehensive evaluation of RV function. Plus, you’ll earn 1 CME credit!
(Earn 1 CME credit and master S’ wave)
Ready to Go Beyond S’ Velocity?
For a complete roadmap to right-heart evaluation, explore the All Right Heart Quantification Modules Bundle You’ll cover every RV parameter — with step-by-step guidance, clinical integration, and 5.0 CME credits.
All RV parameters • Step-by-step guidance • Clinical integration
Resources
Mukherjee M, Rudski LG, Addetia K, et al. Guidelines for the echocardiographic assessment of the right heart in adults and special considerations in pulmonary hypertension: Recommendations from the American Society of Echocardiography. J Am Soc Echocardiogr. 2025;38(3):141-186. doi:10.1016/j.echo.2025.01.006
Rudski LG, Lai WW, Afilalo J, Hua L, Handschumacher MD, Chandrasekaran K, Solomon SD, Louie EK, Schiller NB. Guidelines for the Echocardiographic Assessment of the Right Heart in Adults: A Report from the American Society of Echocardiography. J Am Soc Echocardiogr. 2010;23(7):685–713. DOI: https://doi.org/10.1016/j.echo.2010.05.010
Lang RM, Badano LP, Mor-Avi V, et al. Recommendations for Cardiac Chamber Quantification by Echocardiography in Adults: An Update from the American Society of Echocardiography and the European Association of Cardiovascular Imaging. J Am Soc Echocardiogr. 2015;28(1):1–39.e14. DOI:10.1016/j.echo.2014.10.003