Last Updated on October 29, 2025 by Don Gerig, RDCS
As sonographers, we’ve all experienced that patient who presents with shortness of breath and can’t lie flat for their echocardiogram. As we begin to scan, we immediately visualize a large pericardial effusion surrounding the heart. Keeping our poker faces in check, we take charge and perform a thorough evaluation, assessing the size of the effusion and ruling out the presence of cardiac tamponade.
It’s not often we encounter a life-threatening condition, but when we do, we need to confidently identify the echo signs of tamponade and provide the physician with essential, accurate findings.
Basics of the Pericardium
The pericardium is made up of two layers: a fibrous sac and a serous membrane. The fibrous pericardium anchors the heart to the great vessels, sternum, and spine, while the serous membrane forms two smooth layers that glide against each other during the cardiac cycle.
- The parietal layer forms the outer lining of the pericardium.
- The visceral layer (also called the epicardium) is the inner layer that covers the heart surface.
- A normal pericardium measures less than 2 mm thick on echo.
In a normal adult, the pericardial space contains about 20–60 mL of fluid — an ultrafiltrate of plasma drained by the lymphatic system. This lubricated sac acts as a flexible barrier and provides several key functions:
- Maintains the heart’s position within the thorax
- Prevents friction between the heart and surrounding structures
- Acts as a barrier against infection and inflammation
- Limits acute chamber dilation during diastole
Pericardial Hemodynamics
Now let’s cover basic hemodynamics of the pericardium. Under normal conditions, pericardial pressure is low and follows intrapleural and right atrial pressure changes, meaning it varies with respiration. This pressure variation promotes venous return and right-heart filling.
The pericardium can easily accommodate a small amount of excess fluid — typically up to 250 mL — before intrapericardial pressure begins to rise.
Think of a balloon that’s three-quarters full of air: it can still stretch slightly when compressed, then return to shape once released. The pericardium behaves much the same way, until it reaches its elastic limit.
Understanding Pericardial Effusions
A pericardial effusion occurs when an excessive amount of fluid accumulates within the pericardial space, leading to increased pericardial pressure. As the pressure rises, it begins to compress the heart and restrict its normal motion.
This pressure can have several hemodynamic effects:
- Limits diastolic filling of the cardiac chambers
- Raises diastolic pressures, especially in the right heart
- Reduces stroke volume and cardiac output
Common causes of pericardial effusion on echo include infection, trauma, inflammation, malignancy or radiation, and idiopathic etiologies.
Early recognition of echo findings of pericardial effusion is essential to prevent progression to cardiac tamponade.
Cardiac Tamponade
This my friends, is the extreme case of a pericardial effusion! Think… LIFE-THREATENING EMERGENT SITUATION!
Cardiac tamponade occurs when rising pericardial pressure and excessive fluid within the sac impair normal cardiac filling. In simple terms, the heart is being compressed and squeezed. The diagnosis of tamponade exists on a spectrum of hemodynamic abnormalities, and recognition of these echo signs of tamponade is critical for timely intervention.
Think back to our balloon analogy. If the balloon is filled to its maximum, it becomes stiff and can no longer expand. The same happens to the pericardium: once stretched to its limit, it can’t accommodate additional volume or pressure.
What Happens During Inspiration
- The right heart can no longer expand outward because of pericardial constraint.
- Venous return increases, but the extra volume can only be accepted if the ventricular septum shifts leftward, making room for right-sided filling.
- This septal shift reduces left ventricular filling, stroke volume, and cardiac output.
- The result: a drop in systolic blood pressure — known as pulsus paradoxus.
The severity of tamponade depends on three key factors:
- Volume of fluid in the pericardial space
- Rate of accumulation
- Compliance of the pericardium
Imaging Cardiac Tamponade on Echo
Cardiac tamponade is most often associated with a moderate to large pericardial effusion, but it can also occur with a small or localized effusion, particularly in cases related to aortic dissection, trauma, or post-procedural complications.
One classic echo finding is the “swinging heart”, where the heart literally oscillates within a large fluid-filled pericardial space. The tamponade echo findings can vary widely depending on the underlying cause and hemodynamic impact.
Echocardiography remains the primary imaging tool for assessing both the presence and severity of effusion, as well as its hemodynamic consequences. Every echo lab should have a consistent protocol for evaluating pericardial effusion and tamponade. A complete study should include:
- Evaluation of effusion in all standard echocardiographic views
- Measurement of effusion size at end-diastole in multiple locations
- Assessment of chamber collapse using 2D and M-mode (subcostal, PLAX, and PSAX)
- IVC evaluation with collapsibility index
- Doppler inflow velocity assessment for respiratory variation across the mitral and tricuspid valves
- Hepatic vein Doppler evaluation for characteristic waveform changes
We’ll explore each of these echocardiographic signs of tamponade in more detail below.
Evaluating Pericardial Effusion Size and Location
On echocardiography, a pericardial effusion appears as an anechoic (echo-free) space between the epicardium and parietal pericardium.
A normal or trivial pericardial fluid amount (<50 mL) is typically visible only during systole. When fluid is visualized throughout the entire cardiac cycle (systole and diastole), it indicates a pathologic volume exceeding 50 mL.
Effusion Distribution Patterns
The appearance and distribution of pericardial effusion on echo can vary depending on etiology and patient positioning:
- Circumferential: Fluid surrounds the entire heart uniformly.
- Localized: Fluid is confined to one region of the pericardium, often near the right atrium or right ventricle.
- Loculated: Effusions may contain strands or fibrinous material, appearing stringy and hyperechoic, usually in post-surgical or inflammatory states.
Recognizing both the size and location of effusion is essential for assessing hemodynamic impact and differentiating benign effusions from those at risk for tamponade physiology.
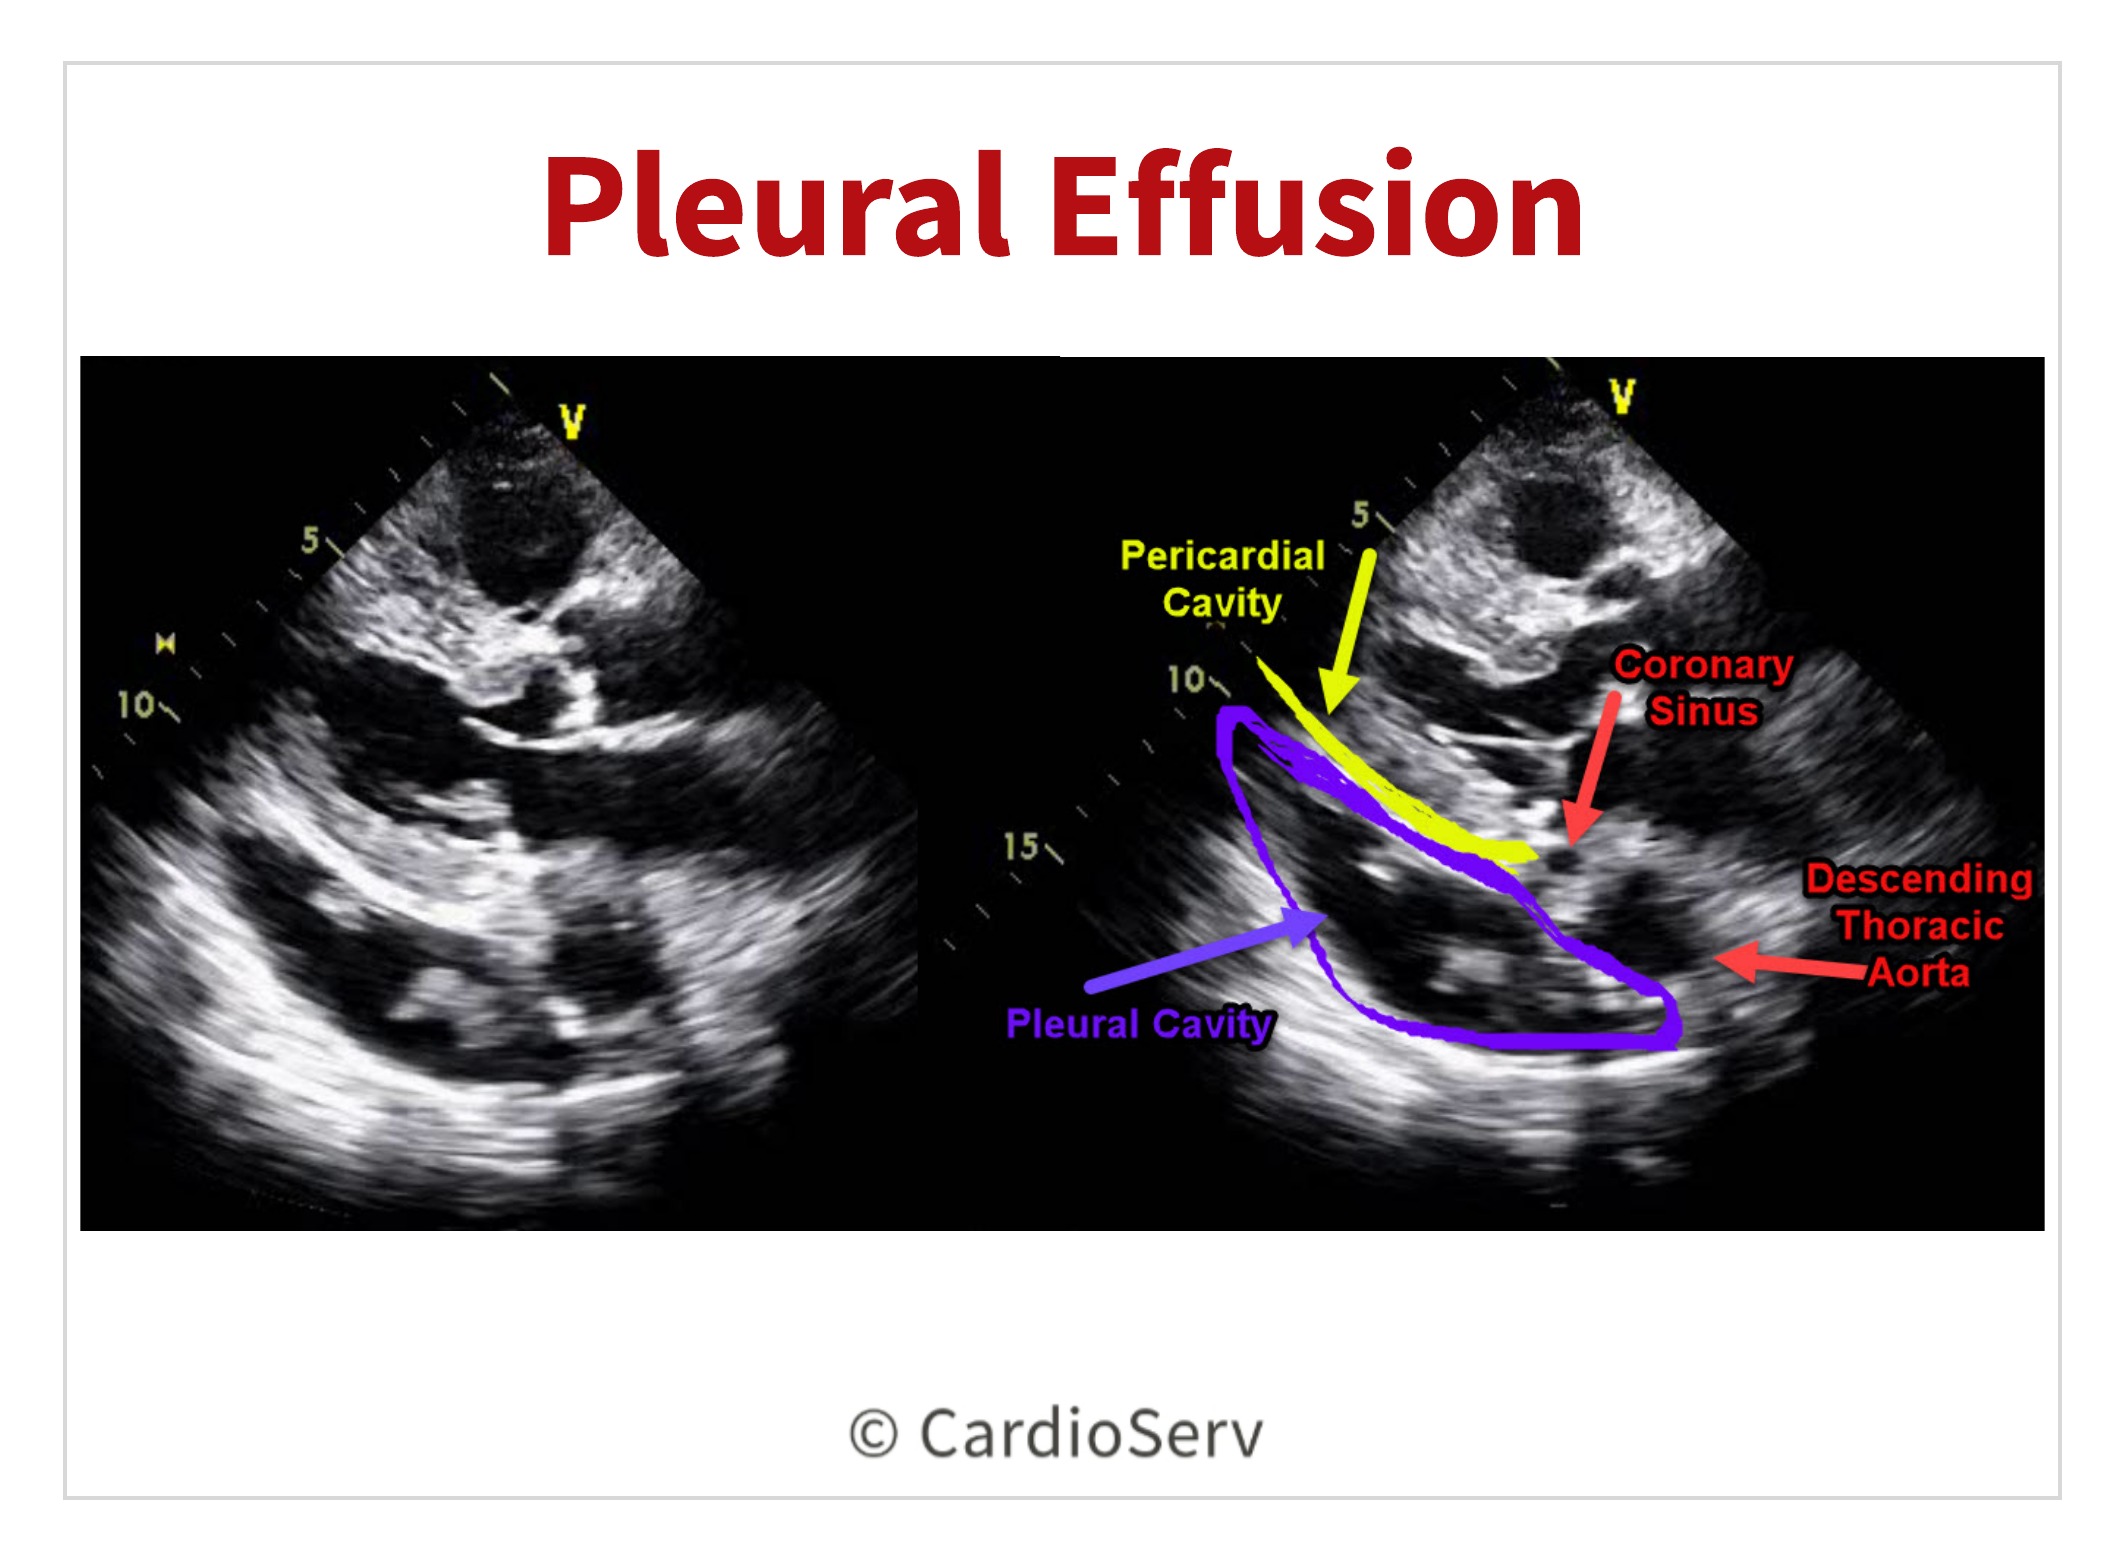
Pleural Effusion vs. Pericardial Effusion on Echo
It is common to mistake a pleural effusion for a pericardial effusion. A pleural effusion is fluid located in the pleural (lung) cavity. A left pleural effusion can commonly be identified in the parasternal long axis view (PLAX).
How to Differentiate on Echo
In order to correctly identify the difference between a left pleural effusion and pericardial effusion, locate the descending thoracic aorta (DTA) and use it as your anatomical landmark:
- Pericardial fluid lies anterior to the DTA
- Pleural fluid lies posterior to the DTA
This visual cue is one of the most reliable methods for distinguishing pleural vs pericardial effusion on echo in the PLAX view.
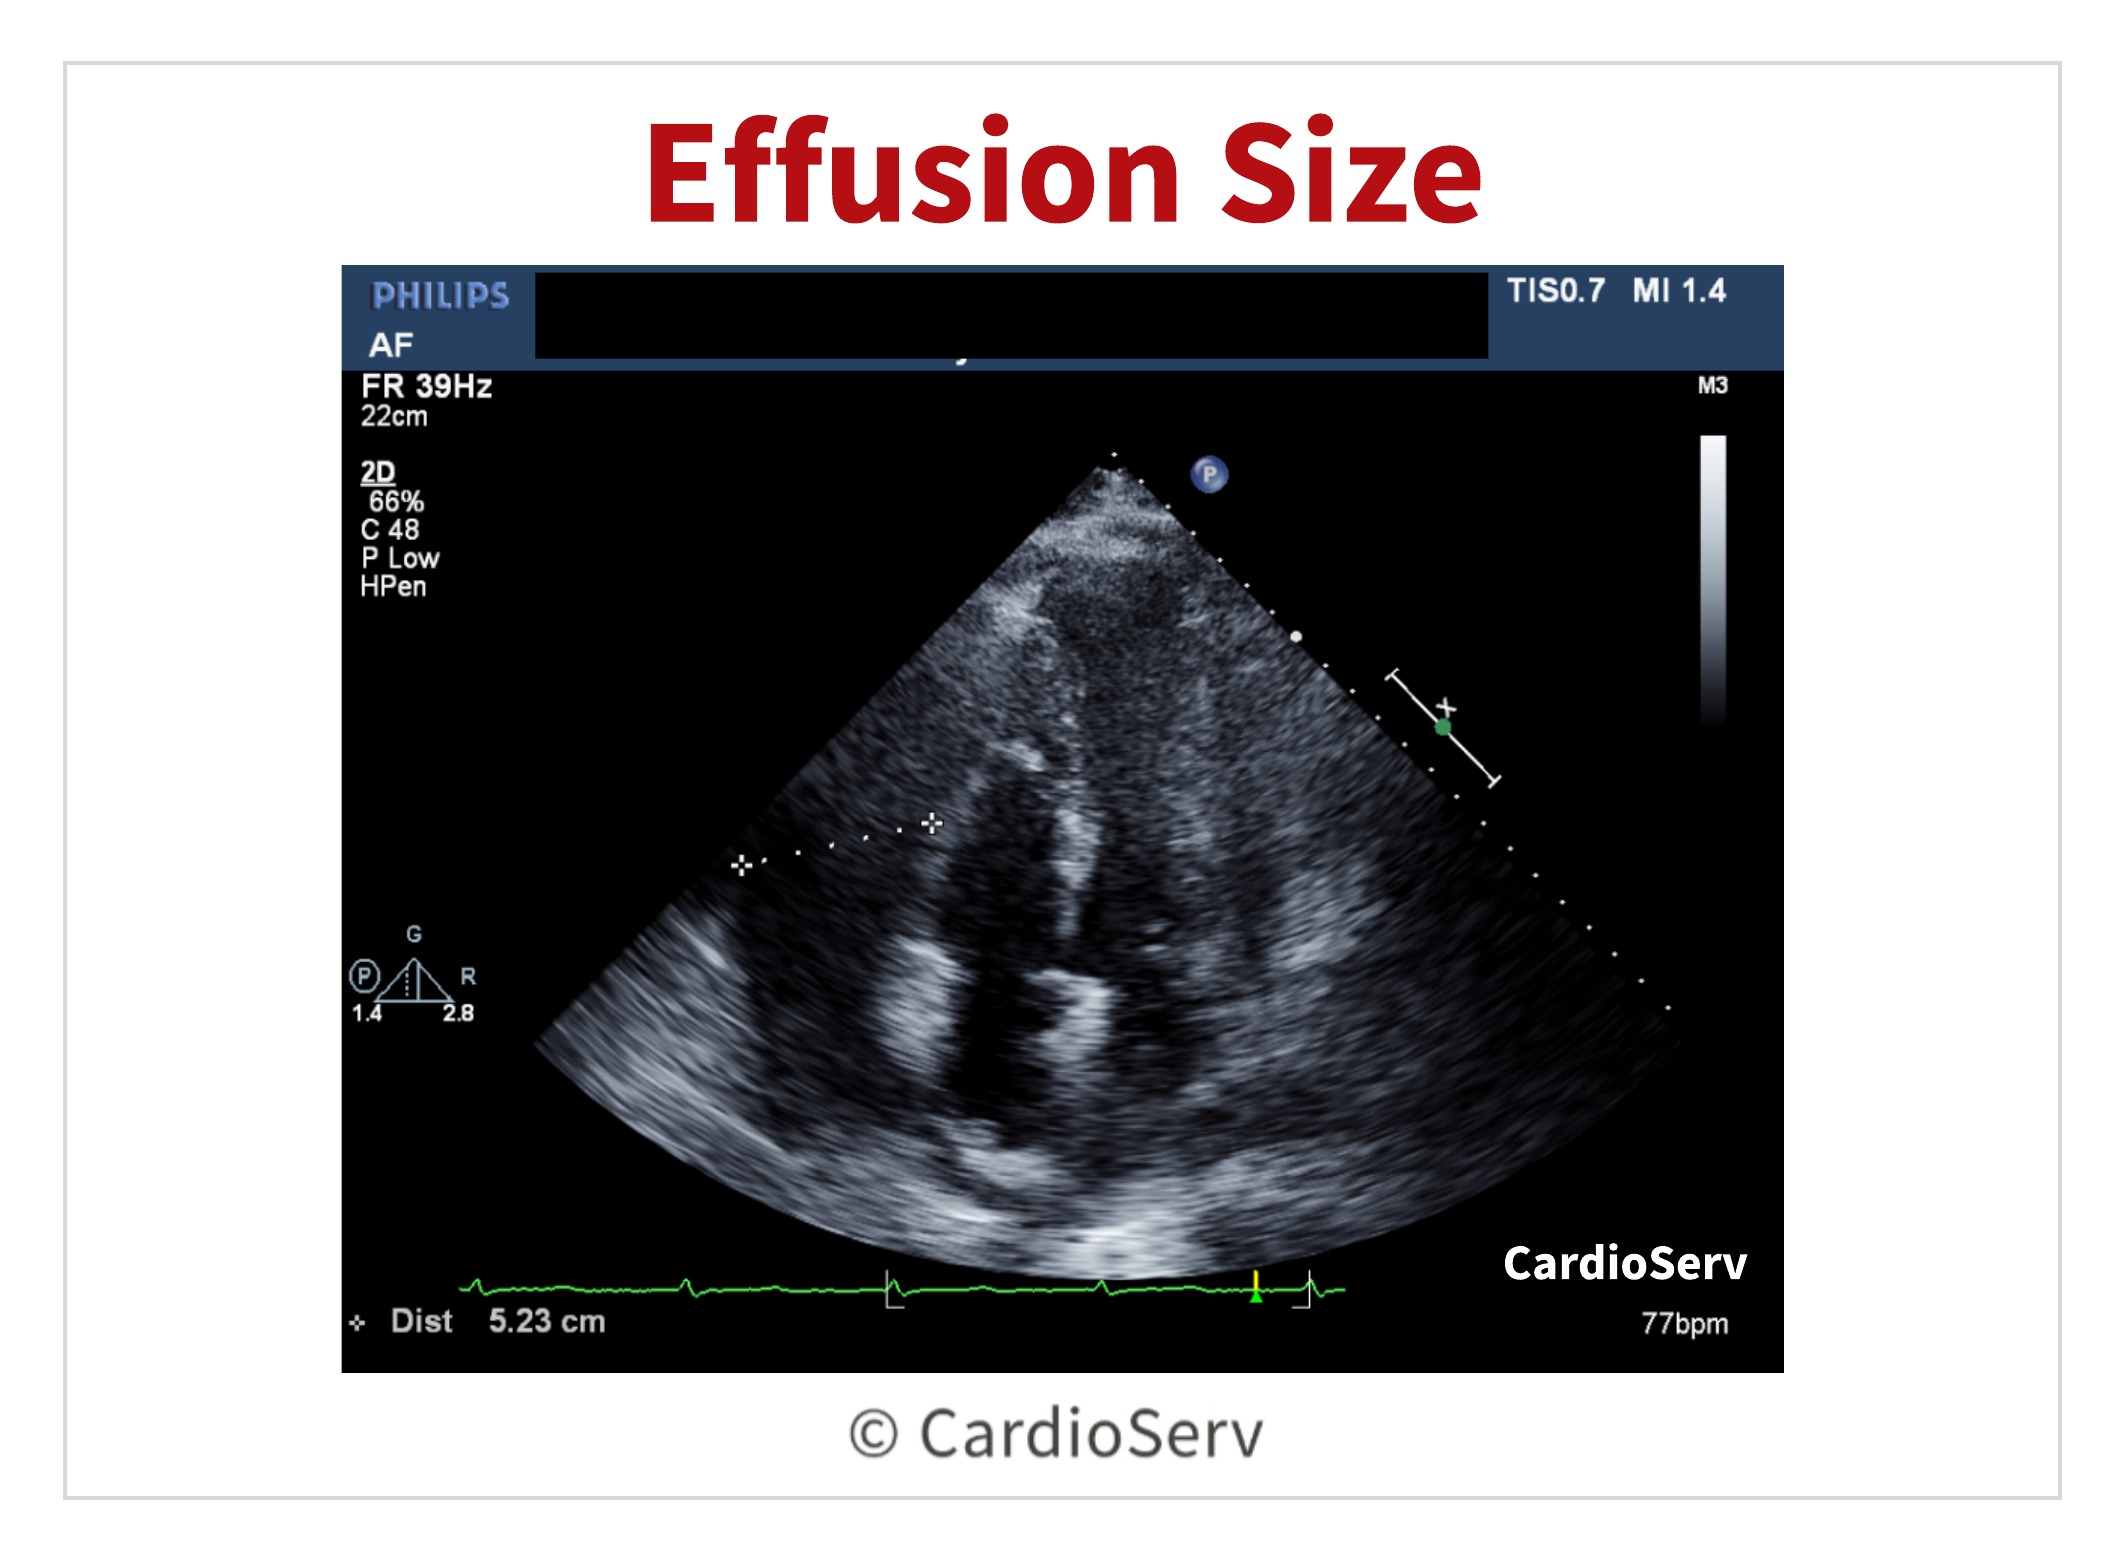
Measuring the Pericardial Effusion
To measure the size of the pericardial effusion, a caliper is placed between the epicardium and parietal pericardium at end-diastole.
- Small effusion: < 10 mm
- Moderate effusion: 10-20 mm
- Large effusion: > 20 mm
The largest pocket measured should be placed on echo report along with the distribution of fluid (circumferential or localized).
Imaging Chamber Collapse
Chamber collapse will occur when the pericardial pressure exceeds the pressure in the chambers. It is common for the right heart to collapse first.
Right Atrial (RA) Collapse
- First chamber to collapse due to the lowest intracardiac pressure
- Occurs toward end-ventricular diastole (near the R-wave on the ECG)
- Highly sensitive indicator of increased pericardial pressure and early tamponade physiology
Right Ventricular (RV) Collapse
- Occurs after RA collapse, when pericardial pressure rises further
- Seen in early diastole
- Appears during expiration as severity increases
- More specific, but slightly less sensitive marker for tamponade
How to Evaluate Chamber Collapse on Echo
Visual assessment can often identify collapse, but M-mode echocardiography provides more detail and reproducibility.
Technique:
- Place the M-mode cursor through the right ventricle
- Set sweep speed to slow to observe multiple cardiac cycles and respiratory variations
- Evaluate from multiple views for confirmation:
- Subcostal window
- Parasternal short-axis (PSAX)
- Parasternal long-axis (PLAX)
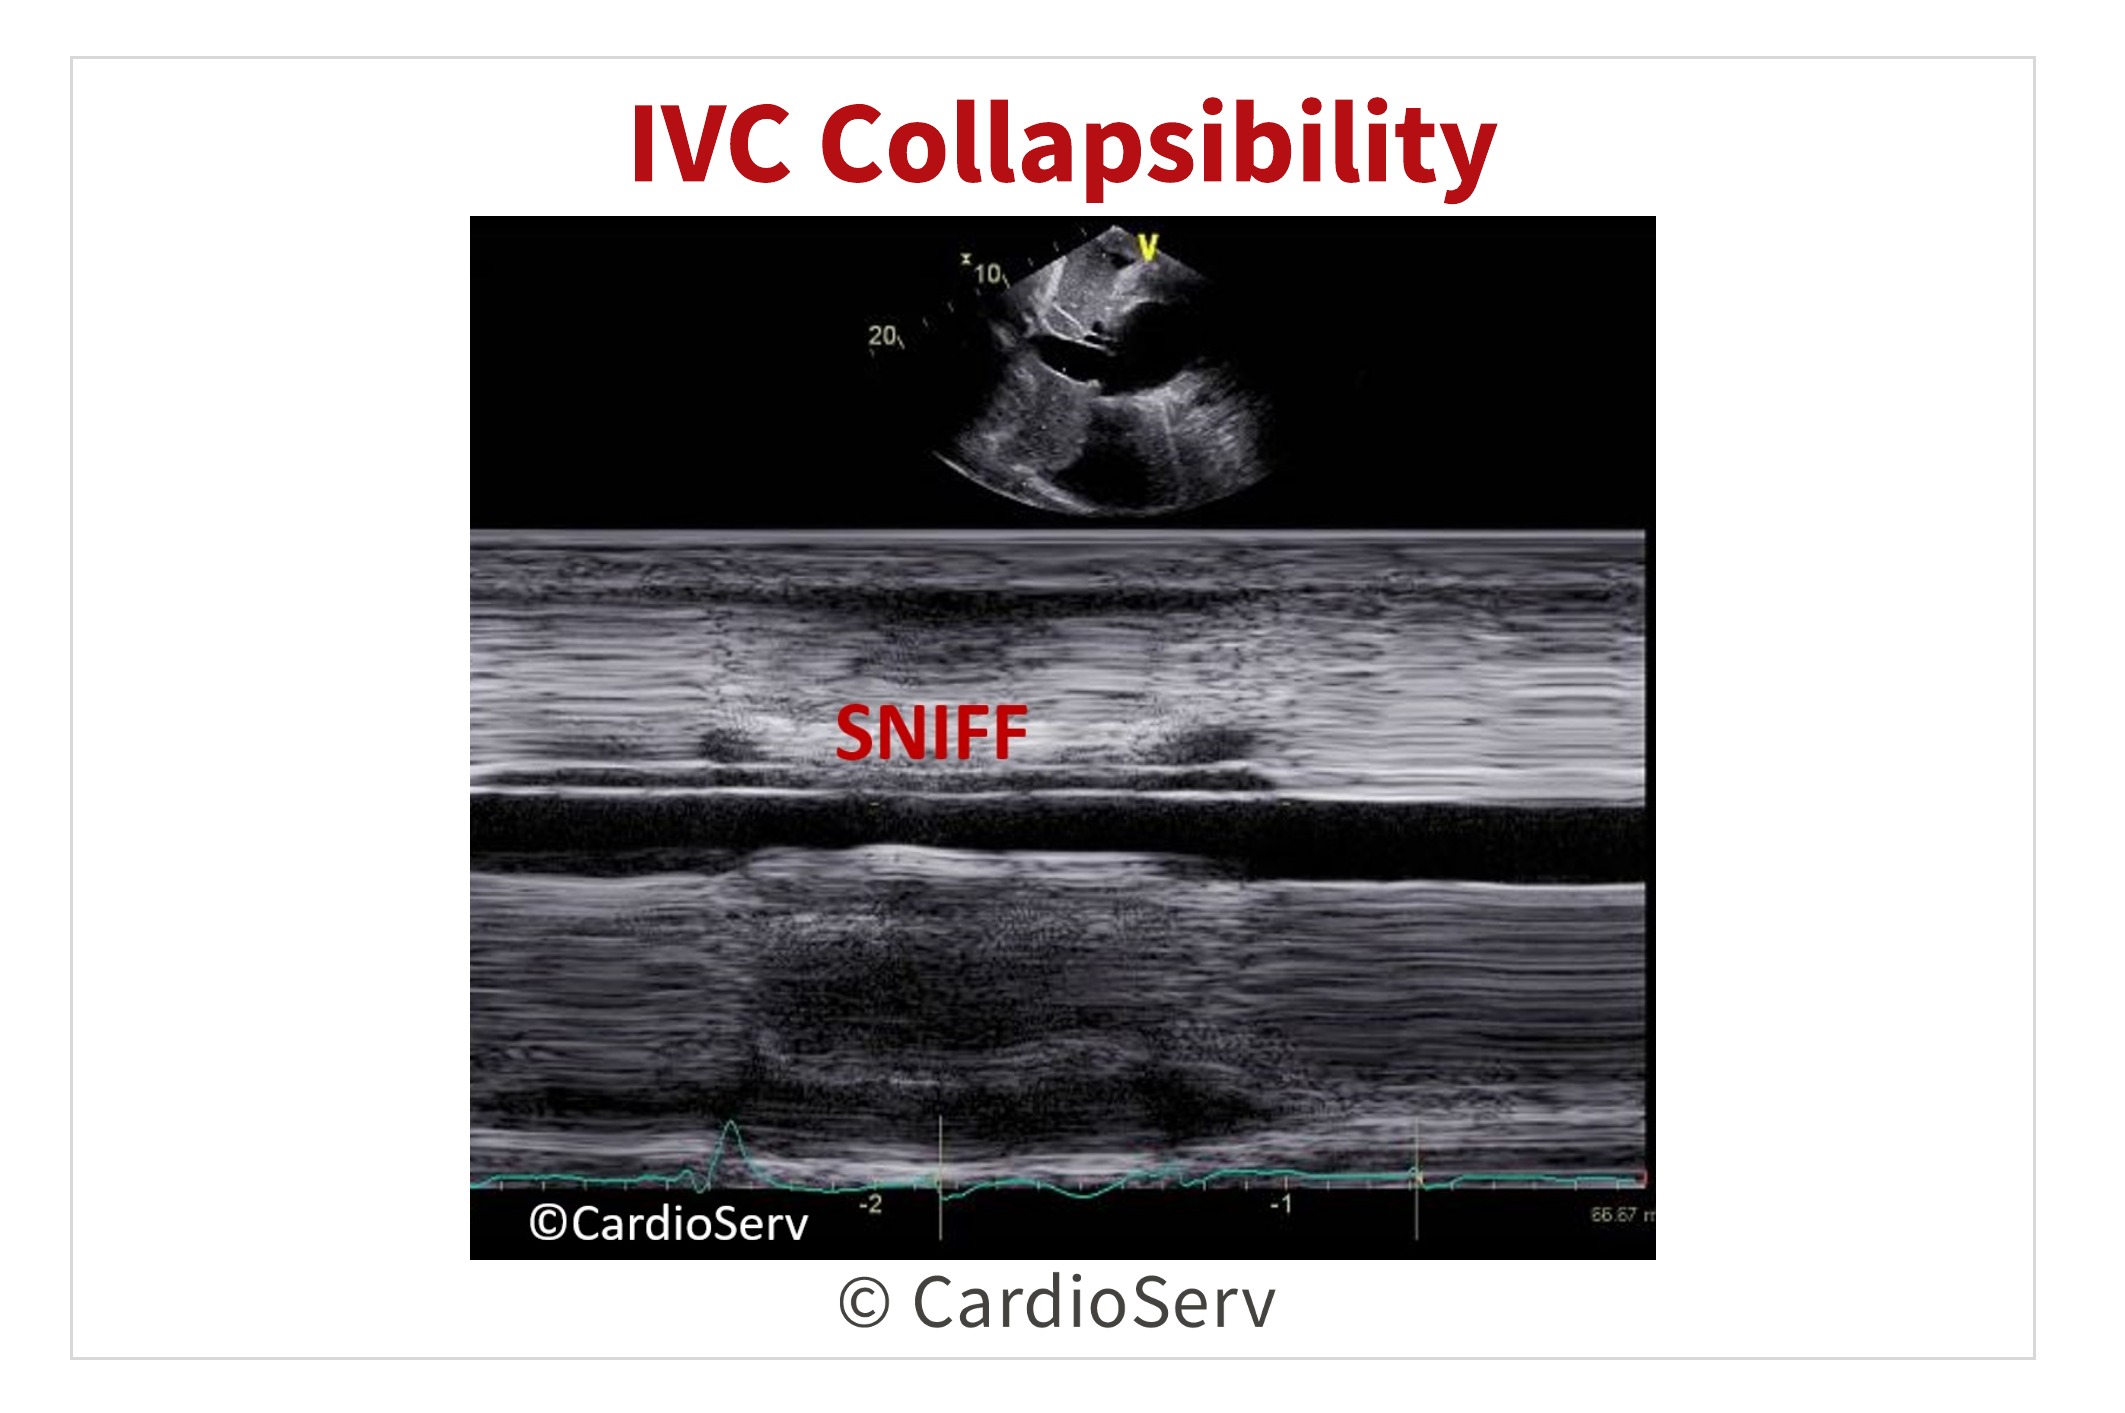
Imaging IVC Collapsibility
IVC evaluation is another key screening tool in the presence of tamponade. Here’s a few tips & techniques on how to properly evaluate the IVC.
Findings Suggestive of Tamponade
- < 50% decrease in IVC diameter during inspiration or sniff
- Indicates elevated right atrial pressure and reduced venous return
- Considered a highly sensitive marker for the presence of tamponade physiology
Important Considerations
While helpful, IVC collapsibility on echo is not specific to tamponade. Other conditions such as volume overload, elevated right atrial pressure, pulmonary hypertension, or mechanical ventilation can also reduce IVC variation.
Imaging Respiratory Variation on Echo
Because cardiac tamponade restricts diastolic filling, we often see respiratory variation in both ventricular septal motion and valvular inflow velocities. These findings reflect the hemodynamic interplay between the right and left sides of the heart during inspiration and expiration.
Visualizing the Septal Shift
Observe the interventricular septum (IVS) on 2D imaging:
- Inspiration: the septum shifts toward the left ventricle (LV) as right heart filling increases.
- Expiration: the septum shifts toward the right ventricle (RV) as left heart filling rebounds.
This “septal bounce” or “shifting septum” is one of the hallmark echo signs of tamponade and helps confirm ventricular interdependence.
Additional Clues
- The degree of septal shift typically correlates with tamponade severity.
- Evaluate using M-mode or real-time 2D to visualize the dynamic motion through the respiratory cycle.
Doppler Evaluation of Respiratory Variation
In the presence of cardiac tamponade, the peak filling velocities of the tricuspid and mitral valves demonstrate respiratory variation due to the shifting balance of intrathoracic and intracardiac pressures.
During inspiration, right heart filling increases, while left heart filling decreases — and the opposite occurs during expiration.
How to Evaluate Respiratory Variation on Echo
Use pulsed-wave (PW) Doppler in the apical four-chamber view, focusing on one valve at a time:
- Position: Obtain a dedicated apical 4-chamber view for the valve being assessed.
- Doppler setup:
- Place the sample volume at the leaflet tips, keeping the cursor parallel to flow.
- Set sweep speed to 25 mm/s (slow).
- Shift the baseline down for optimal display.
- Label respiration:
- Clearly mark inspiration and expiration on the Doppler tracing.
- Run multiple respiratory cycles to capture consistent variation.
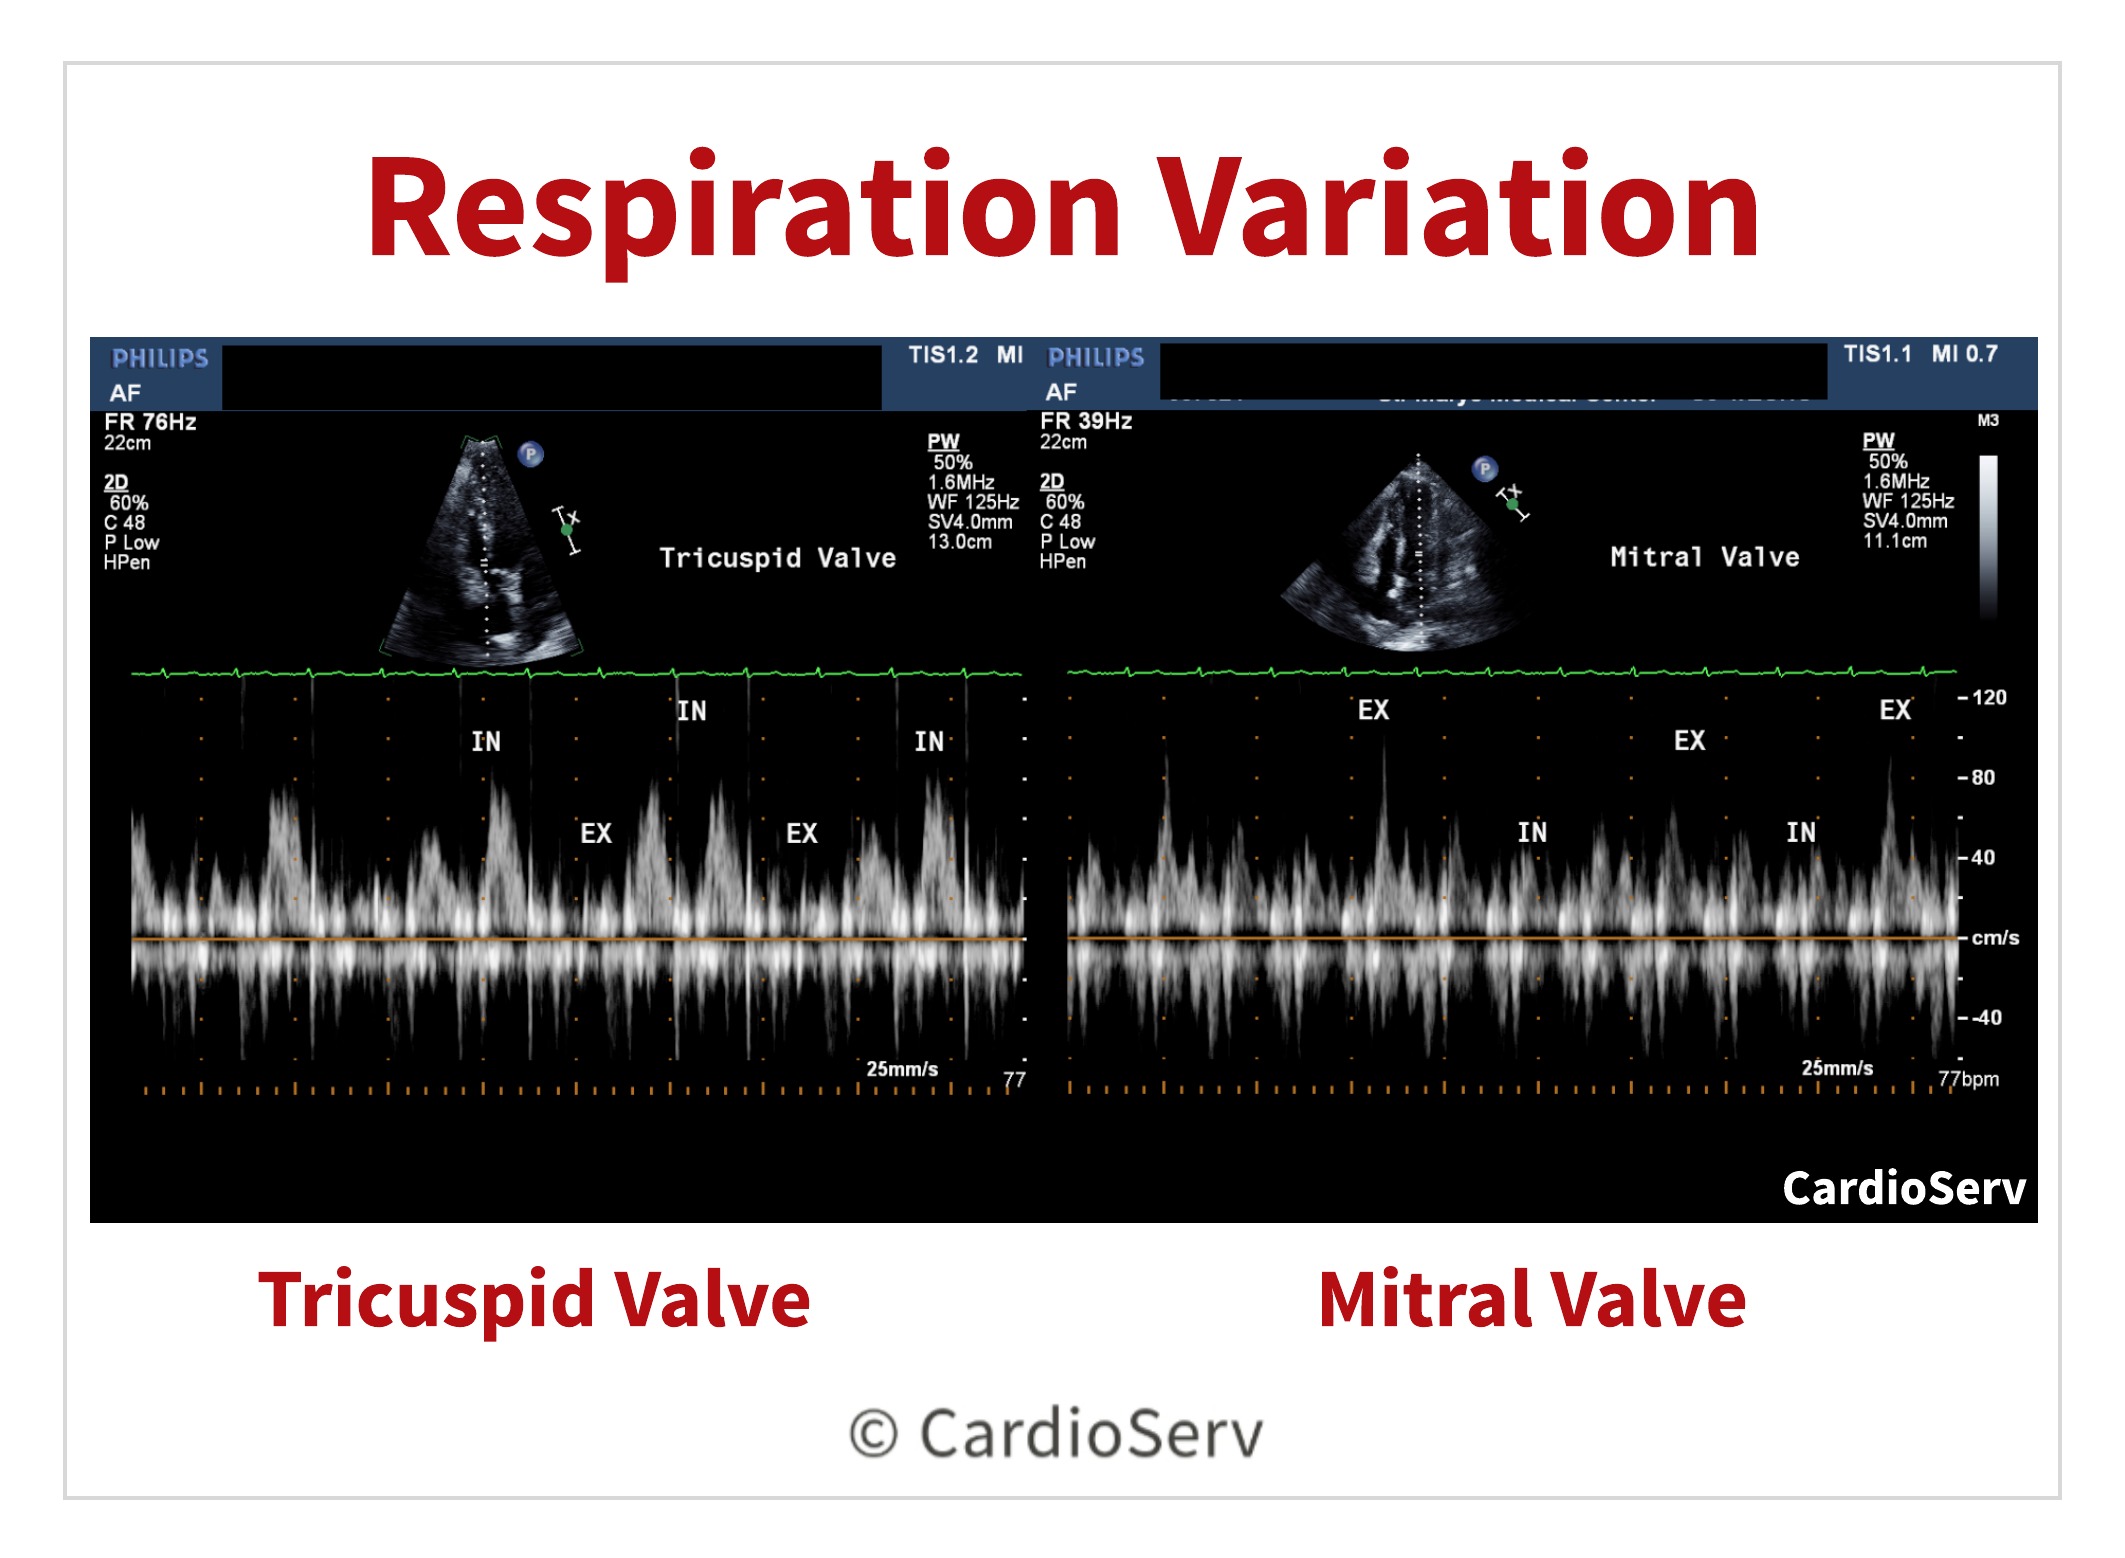
Interpretation Criteria
Evaluate both tricuspid and mitral inflow velocities for Doppler respiratory variation:
- Tricuspid Valve: evaluate for >60% change in E-wave velocity
- Inspiration- INCREASE
- Expiration- DECREASE
- Mitral Valve: evaluate for >30% change in E-wave velocity
- Inspiration- DECREASE
- Expiration- INCREASE
The hepatic veins will also demonstrate respiration variation.
- Normal forward flow of systolic & diastolic velocities appear below baseline during inspiration
- Tamponade will display either the reversal of diastolic flow above baseline or diminish during expiration
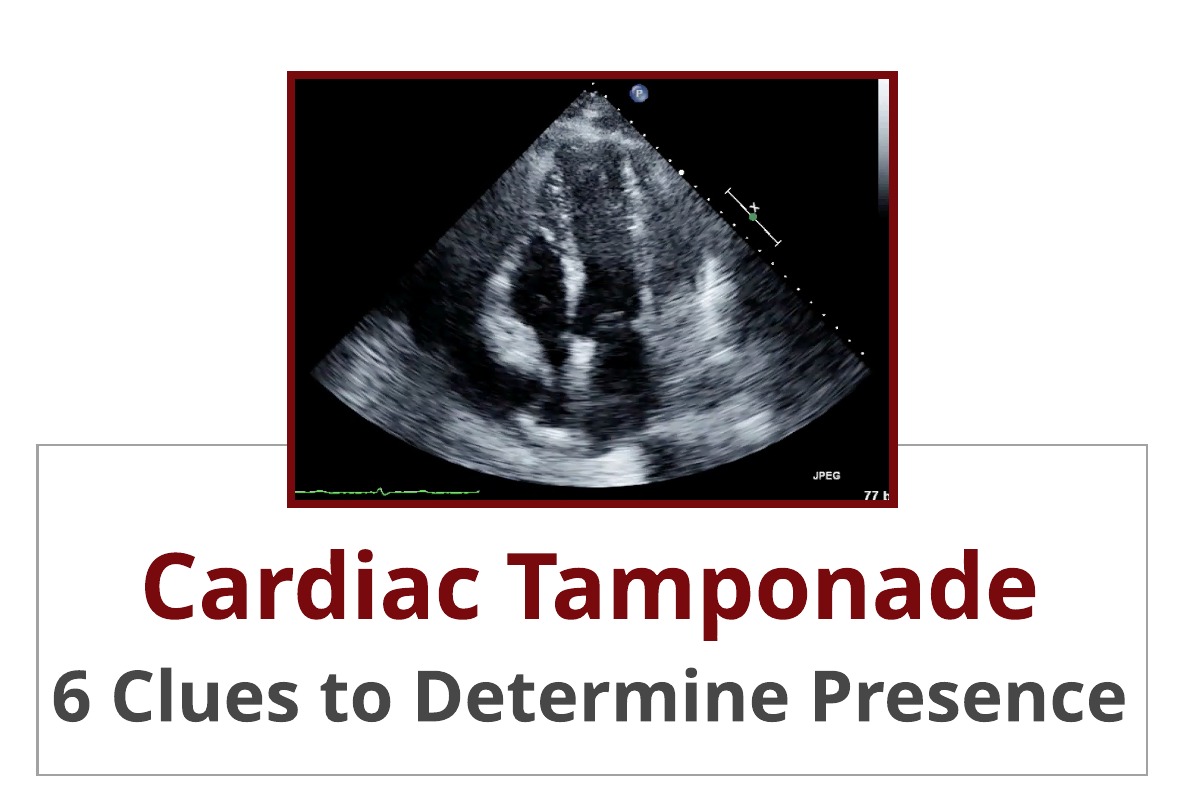
6 Clues on Echo to Detect Cardiac Tamponade
When evaluating a patient for cardiac tamponade, echocardiography provides multiple diagnostic clues. No single finding is definitive on its own. Instead, the presence of multiple echo signs of cardiac tamponade strengthens diagnostic confidence.
Here are six key findings to assess on echo:
- Effusion Size: Measure the largest diameter of the pericardial effusion at end-diastole.
- Chamber Collapse: Look for right atrial (RA) or right ventricular (RV) collapse during diastole.
- IVC Collapsibility: Note < 50% inspiratory collapse of the inferior vena cava (IVC).
- Tricuspid Inflow Variation: Identify > 60% respiratory variation in tricuspid E-wave velocity.
- Mitral Inflow Variation: Identify > 30% respiratory variation in mitral E-wave velocity.
- Hepatic Vein Flow Pattern: Observe diminished or reversed diastolic forward flow in the hepatic veins during expiration.

Andrea Fields MHA, RDCS, Cardiac Clinical Director
References:
Otto, C. M. (2017). The practice of clinical echocardiography. Philadelphia, PA: Elsevier.