After learning the pericardial disease spectrum in Part 1 of our pericardial disease series, the natural next step is mastering the first question in the Three-Step Framework:
Is there fluid?
Seems like a simple enough thing to do, right?
Well, it’s not always as straightforward as you might hope.
Misinterpreting an effusion can lead to unnecessary follow-up, missed tamponade physiology, or failure to identify postoperative complications. That’s why precision at this early stage of assessment is critical.
Sonographers can be fooled by anatomical structures, fat pads, artifacts, postoperative fluid, or even lung pathology masquerading as pericardial fluid.
In today’s article you’ll learn the core skills every sonographer and cardiologist needs to know in order to confidently and accurately report on pericardial effusions, including:
how to recognize an effusion
how to measure it correctly
how to avoid the common mimics
and when to worry about what you’re seeing
First Things First. What Is a Pericardial Effusion?
A pericardial effusion is simply fluid in the pericardial space, the thin gap between the parietal and visceral pericardium.
But echo doesn’t just show us the fluid. Echo also shows us how the fluid interacts with the heart, and that’s what matters most.
What To Look For On Echo
Echo-lucent or echo-poor space between visceral and parietal pericardium.
Best seen posteriorly in parasternal long-axis or subcostal four-chamber view.
Shifts with patient position; fat does not.
Often first appears posterior, then becomes circumferential as it grows
The Three Views That Never Lie
To confidently call a pericardial effusion, start with these imaging windows:
Parasternal Long-Axis (PLAX)
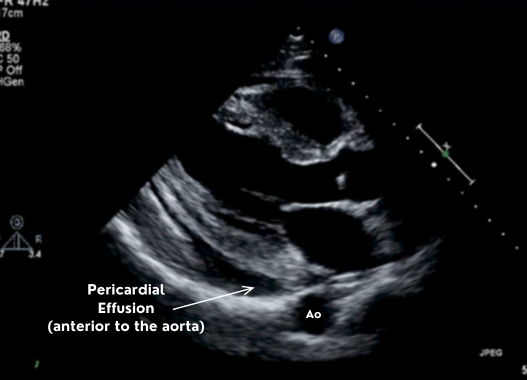
The parasternal long axis gives you the descending aorta which is the single best landmark for distinguishing pericardial from pleural fluid.
Fluid posterior to the aorta → pleural. Fluid anterior to the aorta → pericardial.
Subcostal 4-Chamber
The subcostal 4-chamber view provides the best “global” view. It’s great for seeing circumferential effusions and assessing effusion size in multiple planes. In addition, you can easily evaluate the IVC from this window.
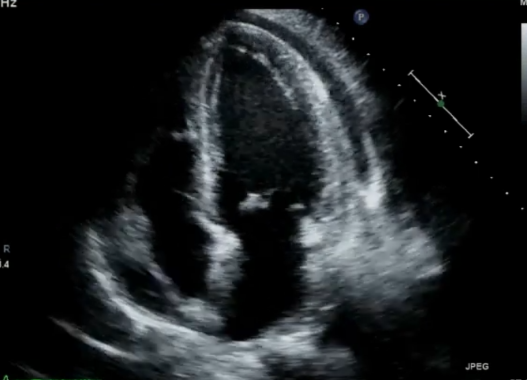
Apical 4-Chamber
The apical 4-chamber view is helpful for visual confirmation. Although not the primary measurement window, it often reveals fluid you may miss elsewhere.
How to Measure a Pericardial Effusion (ASE Standard)
ASE recommends measuring the largest echo-free space at end-diastole, taken perpendicular to the heart wall and measured inner-edge to inner-edge.
These measurements haven’t changed for years, and consistency is what improves reporting.
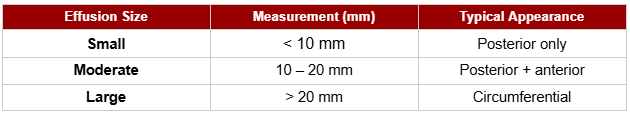
Pericardial Effusion Grading (ASE):
Distribution matters too: Posterior only? Anterior + posterior? Circumferential? Loculated?
CardioServ tip: Measure where the pocket is largest, not where it’s easiest.
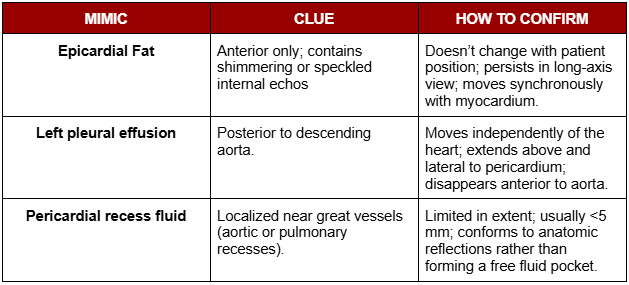
Don’t Get Fooled: 3 Most Common Pericardial Effusion Mimics
Not every dark space around the heart is a pericardial effusion. In fact, several normal structures and artifacts can imitate fluid if you’re not watching closely.
These are the three most common mimics, or pericardial effusion look-alikes, and is where many sonographers get tricked.
Epicardial Fat-Pad
Located anterior
Are echogenic or speckled
Move with the heart and do not change with patient position
Often thick, irregular, or “fluffy”
Typically does not extend around the apex
CardioServ Tip:
When in doubt, rotate to short-axis. Fat-pads can become obvious. Effusions will stay clean and black.
Pleural Effusion
This is the #1 miscalled effusion among newer sonographers, and even experienced readers can get tripped up when windows are limited.
The key is to anchor yourself to one simple structure:
👉 The descending aorta
This landmark reliably separates pleural from pericardial spaces in the parasternal long-axis (PLAX) view.
Pleural effusion characteristics:
Located posterior to the descending aorta
May appear large and dramatic, especially in the PLAX window
Moves independently of the heart
Can extend far beyond cardiac borders (above/lateral to the pericardium)
CardioServ Tip:
If you see fluid behind the descending aorta → it is NOT pericardial.
Pericardial Recess Fluid
Pericardial recesses are normal extensions of the pericardial space that wrap around the great vessels. Small amounts of fluid can collect here, creating tiny focal pockets that:
Usually < 5 mm
Conforms to anatomic reflections instead of forming a true free-flowing effusion
May appear only in certain views or angles
Because of their location near the aorta, pulmonary artery, or atrial appendages, they can easily be overcalled as localized effusions.
Effusion Size Does Not Predict Severity
This is one of the most important clinical truths about pericardial disease, and one that’s commonly misunderstood.
**A large effusion does not mean tamponade.
A small effusion does not mean the patient is safe.**
In other words, don’t judge an effusion’s severity by its size:
Why?
Because the rate of accumulation, not the volume, determines whether intrapericardial pressure rises enough to impair filling.
The Reporting Piece (Where Most Variability Happens)
Even when the effusion is correctly identified,reporting inconsistencies are common. Using ASE-consistent terminology not only improves clarity between sonographers and cardiologists but also reduces misinterpretation when patients are followed over time.
A high-quality pericardial effusion report should always include:
Size (small/moderate/large)
Measurement (in mm, taken in end-diastole)
Distribution (posterior, anterior, circumferential, loculated)
Appearance (simple vs complex)
Change over time (if prior studies are available)
Signs of elevated intrapericardial pressure (early chamber collapse, IVC plethora)
Clear, standardized reporting transforms a visual observation into an actionable clinical message. It ensures the interpreting physician understands not just that fluid is present, but where it is, what it looks like, and whether it’s affecting cardiac function.
Summary
Not everything that looks like fluid is pericardial. Use anatomic landmarks (especially the descending aorta).
Effusion size does not predict severity; rate of accumulation and physiology determine risk.
Use ASE-consistent reporting: size, measurement, distribution, appearance, and any chamber compression.
Always interpret echo findings in the clinical context; echo shows the mechanics; the patient shows the impact.
What’s Next
In the next article, we’ll build on this foundation by shifting from identifying effusion to recognizing when it becomes dangerous. You’ll learn the full hemodynamic cascade of tamponade, how to spot early pressure changes on echo, and the key Doppler clues that reveal when the heart is no longer filling normally.